April 21 S&P 500 futures overview – Charts moved just shy of our upper target yesterday and failed to breach the 2105.25 level overnight. Buyers hold strong again – and no differently under divergent momentum.
Our ranges remain the same but watch for the expansion over 2105.75 to drive shorts to cover and longs to advance into the areas above like 2107.5 to 2110.5.
Under this scenario, 2095.75 will be an important retest. If we can hold this level, the bullish action will continue. Traders have continued to ignore divergent technical behavior beneath, though. Resistance sits near 2105.75 to 2112.75. Support holds tight for now at 2082.5- 2084.
Momentum on the four hour chart is still quite bullish. Short trades here are very countertrend, in general, and should be staged off the rejection of resistance into early support targets. Long trades have paid off handsomely if we have waited for support tests (see the image areas in the chart).
Shorter intraday time frame momentum indicators are now neutral and falling as we test support at 2098 for now. Buyers will try to defend the 2084-2088 price support region once more, likely if rejected at 2095.25.
See today’s economic calendar with a rundown of releases.
THE RANGE OF THURSDAY’S MOTION
Crude Oil Futures (CL_F)
April 21 outlook for Crude oil – In the trading room yesterday, we discussed the likelihood of a march into 44.89 to 45.11, and though I clearly did not anticipate the aggressive ride up, we have remained very bullish on this chart of late.
That said, crude oil currently sits at a clear resistance line around 44.55 with new support holding at 43.93. Thin volume regions provide little support here if the chart loses support levels. I’m looking for a pop up from this support region between 43.89 and 44.07 into resistance that fades. I will really be watching the momentum on the bounce.
Today, the trading ranges for crude oil are 42.58 -44.87. Key support is still near 40.67 – key resistance near 44.89.
Moving averages in oil are bullish on tighter intraday time frames, and bullish on longer intraday time frames – giving the clear advantage to the buyer. Momentum is suggesting that pullbacks into support will hold at the first pass. Resistance ahead will be on the watch. Failure to breach 44.52 at this next test will bring sellers in to exert power on the charts back into support. Breach of that area will create range expansion to the north into 44.89 and perhaps 45.3.
The intraday long trading setup on crude oil futures suggests a long off a 43.97 retest, or the 42.93 positive retest on the pullback (check momentum here) into targets of 43.58, 43.92, 44.14, 44.57, 44.89, and if buyers hold on, we’ll see 45.3 to 45.73.
The intraday short trading setup suggests a short below a 43.83 failed retest, or the failed retest of 44.79 (with negative momentum prevailing) sends us back through targets at 44.45, 44.24, 43.94, 43.68, 43.34, 42.89, 42.44, and 42.05, if sellers hang on.
E-mini S&P 500 Futures (ES_F)
Below is a S&P 500 futures chart with price support and resistance trading levels for today. Click to enlarge.
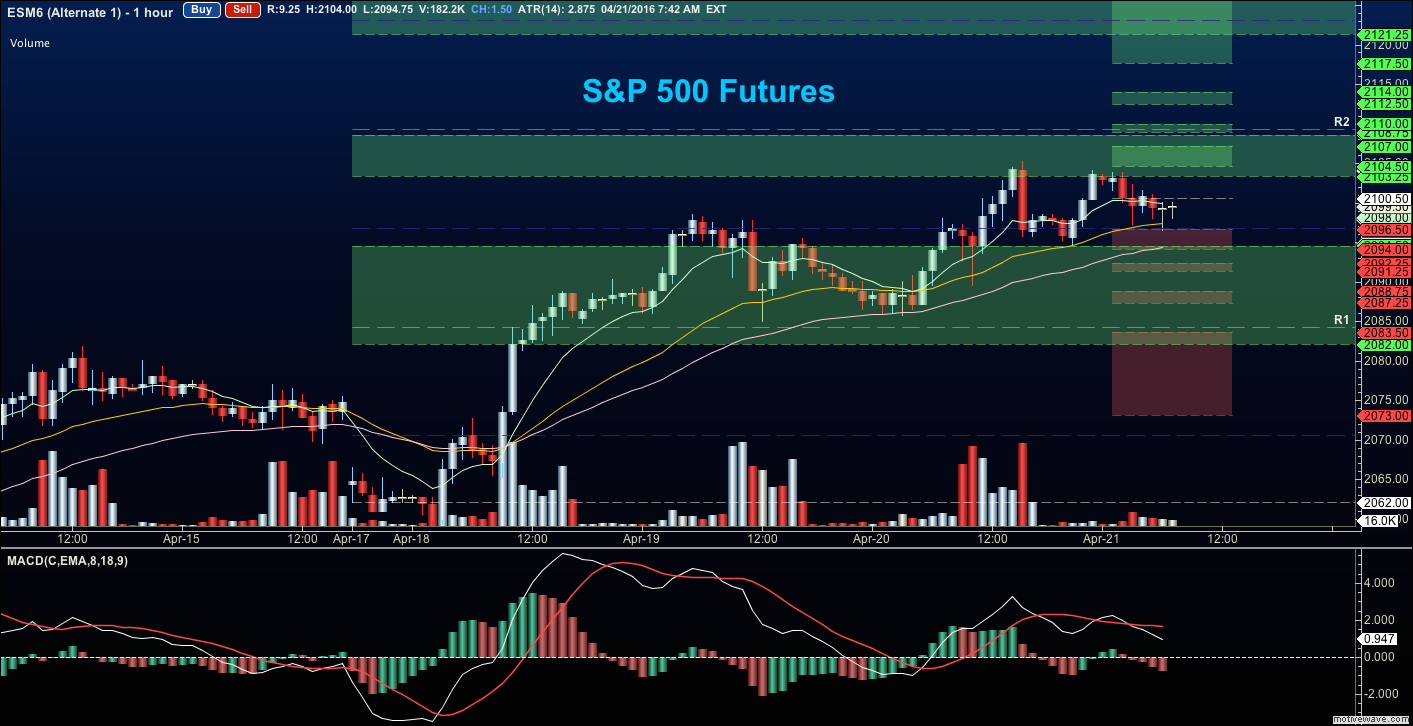
April 21 S&P 500 futures outlook – The levels between 2105.75- 2107.25 serve as front line resistance. Front line support sits near 2088.5- 2094.75 region. Buyers are holding strength for now, but for yet another morning, on damp momentum.
Upside motion on S&P 500 futures has the best setup on the positive retest of 2097.75 or a retest of 2101.25 with positive momentum – eyes on resistance at 2104.75 -2107.25 with this 2101.25 entry. I use the 30min to 1hr chart for the breach and retest mechanic. Targets from 2097.75 are 2101.25, 2104.5, 2105.75, 2107.25, 2110.5, 2112.5, and if we can catch a bid there, we could expand into 2117.5- but that upper level seems extremely unlikely to me at this time. Long action is still trending over the bigger picture for now.
Downside motion opens below the failed retest of 2095.25 or at the failed retest of 2104 with negative divergence (careful here- watch for the higher low to develop to tell you that an early exit might be necessary). Retracement into lower levels from 2104 gives us the targets 2101.25, 2098.50, 2095.75, 2094, 2092.5, 2088.5, and perhaps 2085.75 to 2082.5. Buyers should still come to the rescue at the deep support, particularly at the first pass.
Have a look at the Fibonacci levels marked in the blog for more targets.
If you’re interested in the live trading room, it is now primarily stock market futures content, though we do track heavily traded stocks and their likely daily trajectories as well – we begin at 9am with a morning report and likely chart movements along with trade setups for the day.
As long as traders remain aware of support and resistance levels, risk can be very adequately managed to play in either direction as bottom picking remains a behavior pattern that is developing with value buyers and speculative traders.
Thanks for reading.
Twitter: @AnneMarieTrades
The author trades stock market futures every day and may have a position in mentioned securities at the time of publication. Any opinions expressed herein are solely those of the author, and do not in any way represent the views or opinions of any other person or entity.

: Worrisome to Broader Market?")


