S&P 500 futures have been inching lower while bouncing within congestion territory between 2033.5 and 2047.75. The tests of these two levels will be important to gauge further extensions across stock market futures (on either the long or short side).
So far, S&P 500 futures have recovered 2033 and slogged around in the muck – this shows indecision. The mixed momentum we are seeing means levels will be tested several times before resolution- and that’s playing out in right front of us.
I do see, this time, that negative divergence is holding a bit steady for now so I anticipate that bounces will be sold. Failure to breach S&P 2046 on any bounces will be quite bearish in my mind.
Momentum on the four hour chart is now negative; we are sitting at congestion as I mentioned. Buyers continue to save the day with deep traces south, but sellers continue to prevent price advances to the north.
Shorter time frame momentum indicators are negative but lifting into resistance that now looks like 2042 for now.
See today’s economic calendar with a rundown of releases.
THE RANGE OF THURSDAY’S MOTION
Crude Oil Futures (CL_F)
Crude Oil outlook for April 12 – Note that we have the API report after the close. As the OPEC meeting looms ahead, the chart for crude oil futures is grinding to the north. We hit higher highs overnight but have slowed our move higher with a retrace to old resistance that has become new support near 40.5. The chart remains quite bullish suggesting that pullbacks into support or prior congestion will be bought.
Today, the trading ranges for crude oil are 39.12 -41.8. Key support is near 40.11 – key resistance near 41.8.
Moving averages in oil are now bullish on tighter time frames, helping the grind higher. Longer moving averages show the chart caught in a serpentine of lines.
Intraday long trading setups on crude oil suggest a long off a 40.56 positive retest (check momentum here), or 40.11 positive retest on the pullback into targets of 40.35, 40.54, 40.84, 41.08, 41.33 and if buyers hold on, we’ll see 41.57 to 41.83.
Intraday short trading setups suggest a short below a 40.35 failed retest, or the failed retest of 41.33 (with negative momentum prevailing) sends us back through targets at 41.1, 40.9, 40.62, 40.39, 40.14, 39.84, and 39.2, if sellers hang on.
Have a look at the Fibonacci levels marked in the blog for more targets.
E-mini S&P 500 Futures (ES_F)
Below is a S&P 500 futures chart with price support and resistance trading levels for today. Click to enlarge.
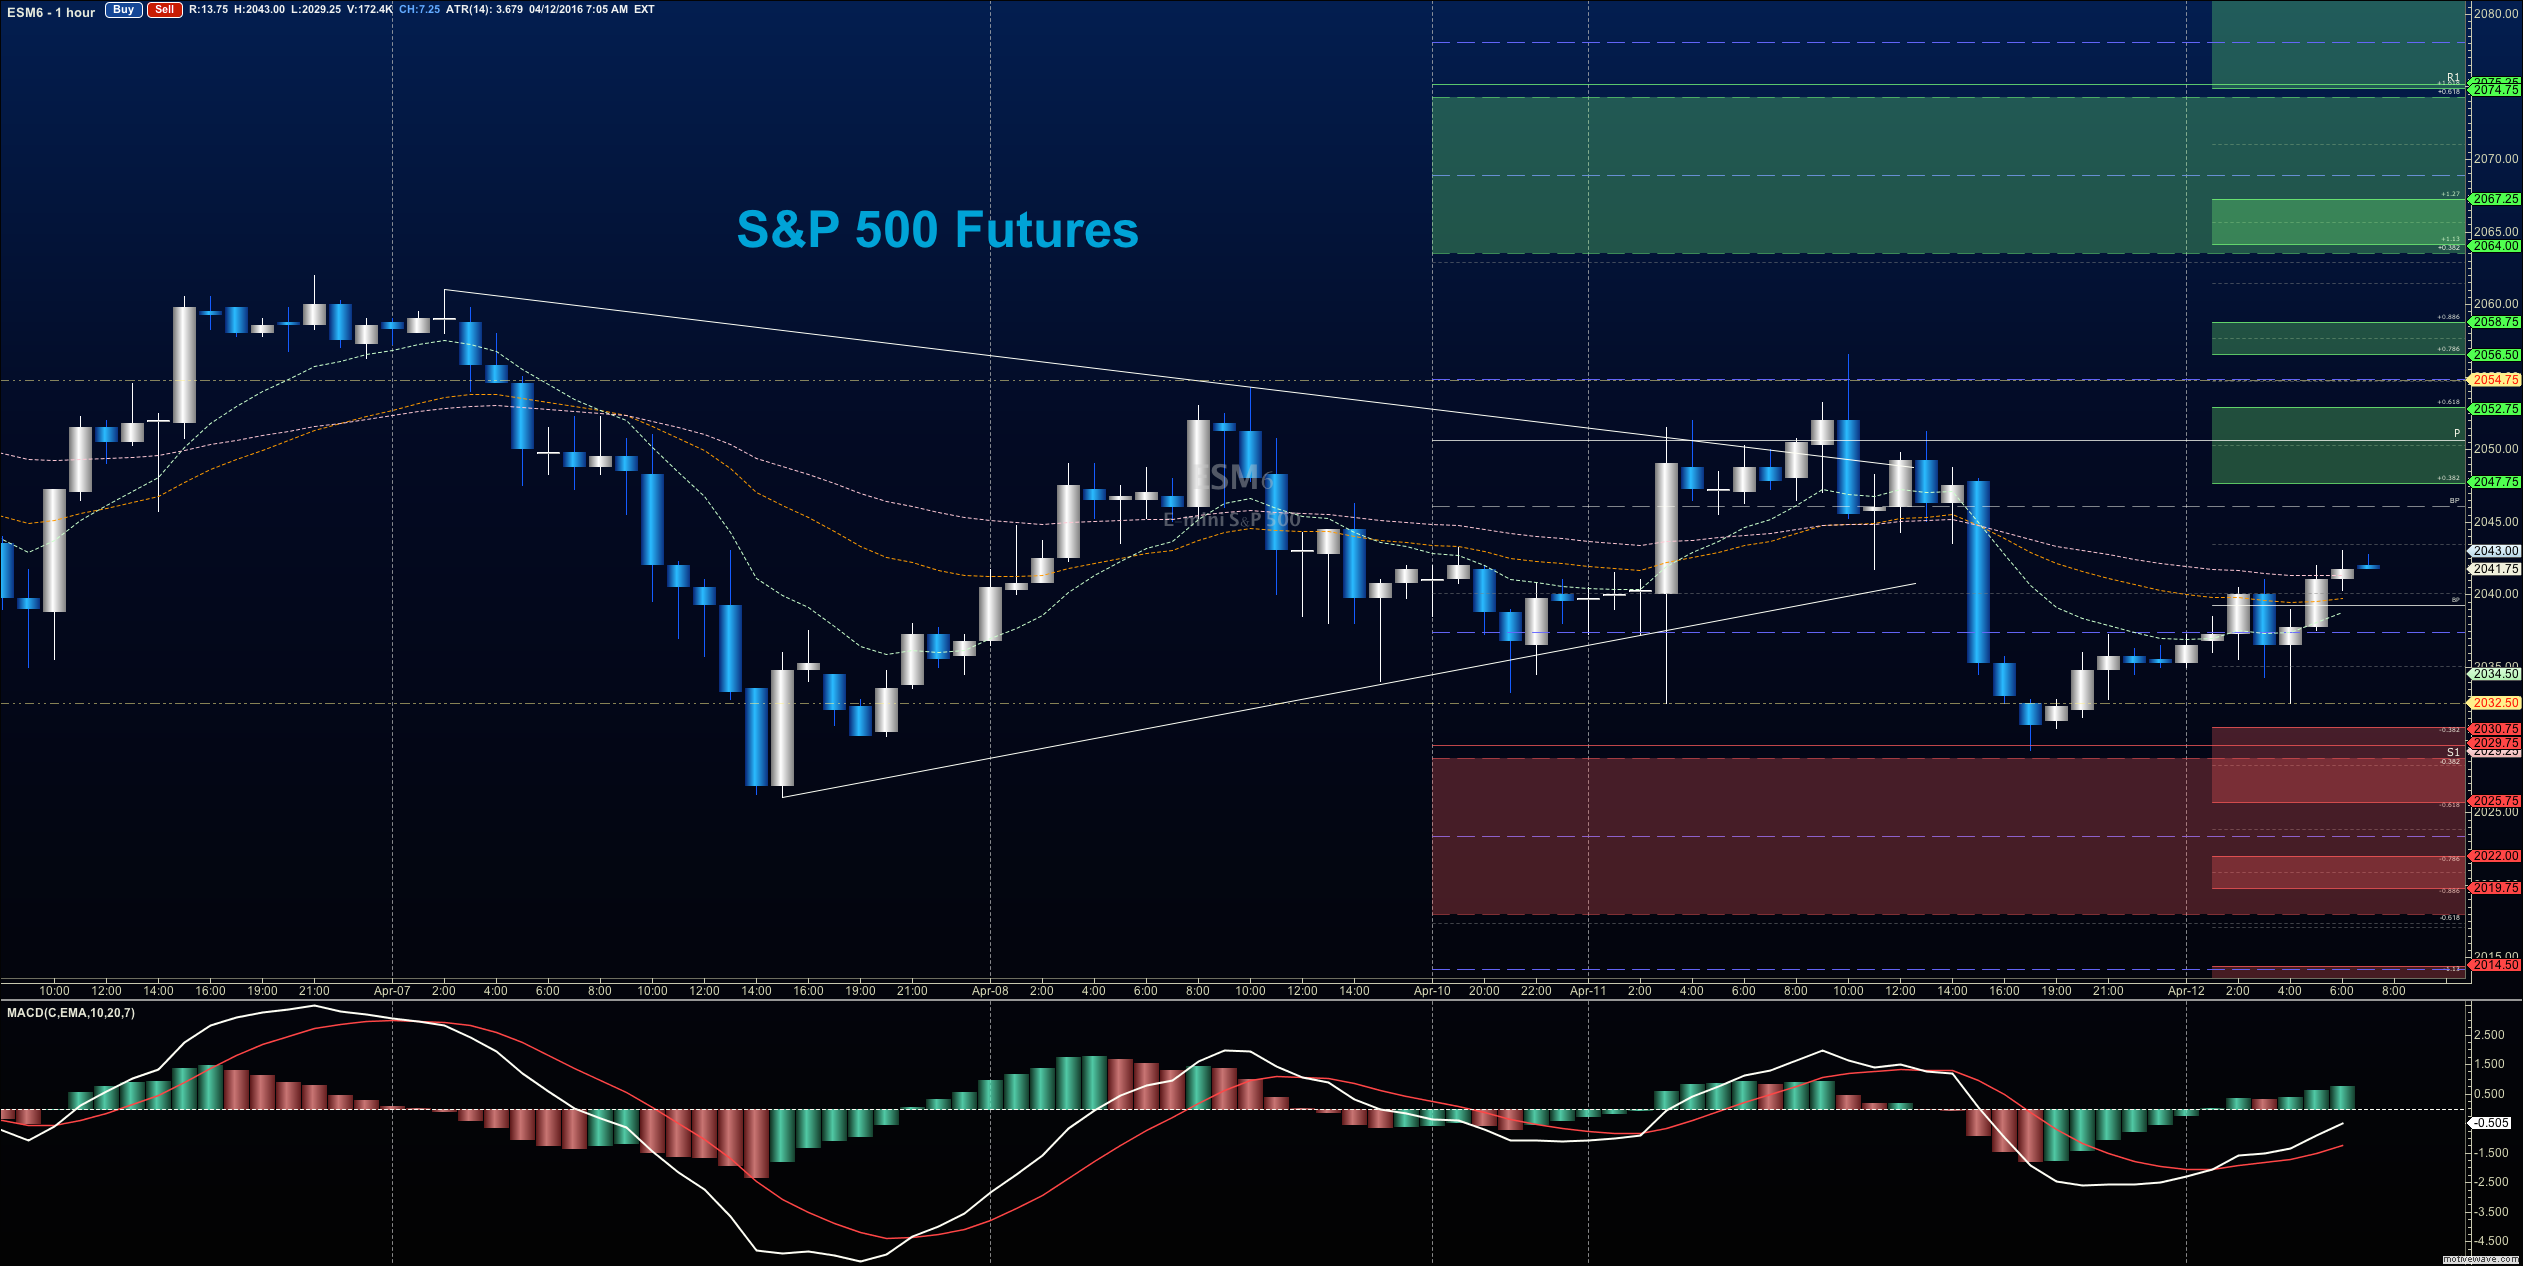
S&P 500 futures outlook for April 12 – The levels between 2046- 2054.5 serve as front line resistance – if buyers take hold we could see the return to 2061.5 to 2067. Front line support sits near 2023.5- 2032.5 region. Though we have pierced the upper bound here, we have seen buyers rush in to bring us back above this region. The buyers will exhaust if they cannot penetrate the levels above 2057 soon. Below there, we could see 2014.75 – 2007 if negative momentum continues.
Upside motion has the best setup on the positive retest of 2042.75 or a breach and retest of 2033.5 with positive momentum. I use the 30min to 1hr chart for the breach and retest mechanic. Targets from 2033.5 are 2038.5, 2040.25, 2042.5, 2044.5, 2047.5, 2049.5, 2051.25, 2054.5, 2057.5, and if we can catch a bid there, we could expand into 2061.5, 2064.25, and 2067.5. Long action is still trending over the bigger picture for now, but momentum is steadily drifting lower.
Downside motion opens below the failed retest of 2038.5 or at the failed retest of 2046.5 with negative divergence (careful here- watch for the higher low to develop to tell you that an early exit might be necessary). Retracement into lower levels from 2046.5 gives us the targets 2044.75, 2040.50, 2038.5, 2035.75, 2032.75, 2029.5, and perhaps 2026.5 to 2023.5. Buyers should still come to the rescue at the deep support, particularly at the first pass.
Have a look at the Fibonacci levels marked in the blog for more targets.
If you’re interested in the live trading room, it is now primarily stock market futures content, though we do track heavily traded stocks and their likely daily trajectories as well – we begin at 9am with a morning report and likely chart movements along with trade setups for the day.
As long as traders remain aware of support and resistance levels, risk can be very adequately managed to play in either direction as bottom picking remains a behavior pattern that is developing with value buyers and speculative traders.
Thanks for reading.
Twitter: @AnneMarieTrades
The author trades stock market futures every day and may have a position in mentioned securities at the time of publication. Any opinions expressed herein are solely those of the author, and do not in any way represent the views or opinions of any other person or entity.

: Worrisome to Broader Market?")


