A rising wedge developed overnight in S&P 500 futures trading. A test of support below is likely – targeting the 1968.5 to 1964.5 zone.
If S&P 500 futures move higher, a breach above the premarket highs could see a test of 1991.5. Charts will become vulnerable to sellers, though, below 1977.5.
The Morning Report: Trading The Consolidation Chop
Momentum on the four hour chart is sloping positive but some negative divergence is present, and in positive territory –higher lows on the horizon- buyers should come in to provide support. Daily charts continue to show momentum as trending positive, and in positive territory.
Shorter time frame momentum indicators are sitting in positive territory, and sloping down. 1968-1964 is the support region on S&P 500 futures to watch for sellers to test and for buyers to hold.
See today’s economic calendar with a rundown of releases.
THE RANGE OF TUESDAY’S MOTION
Crude Oil Futures (CL_F)
The outlook for crude oil futures today is a bit murky as we have a rising wedge with negative divergence. New price support comes in at 34.24 – 34.4. But price pressure seems strong, but negative divergence continues.
Today, the trading ranges on crude oil futures are between 33.5 and 35.2. Expansions outside those zones will retest, and if held will advance in the direction of the break.
Moving averages in oil show us at a decision zone with increasing positive momentum on longer time frames. This generally gives rise to buyers showing up when it seems like the chart will roll, but we should be back to testing higher lows and it seems likely that we’ll see 32.8 – 33.15.
Intraday long trading setups suggest a long off 34.4 positive retest, or 34.24 bounce into 34.46, 34.78, 35.05, 35.2 and if buyers hold on, we’ll see 35.45 to potentially 35.75.
Intraday short trading setups suggest a short below a 34.4 failed retest with negative divergence, or the failed retest of 35.48 sends us back through targets at 34.2, 33.86, 33.56, 33.23, 32.87, 32.59, 32.35, 32.02.
E-mini S&P 500 Futures (ES_F)
Below is a S&P 500 futures chart with price support and resistance trading levels for today. Click to enlarge.
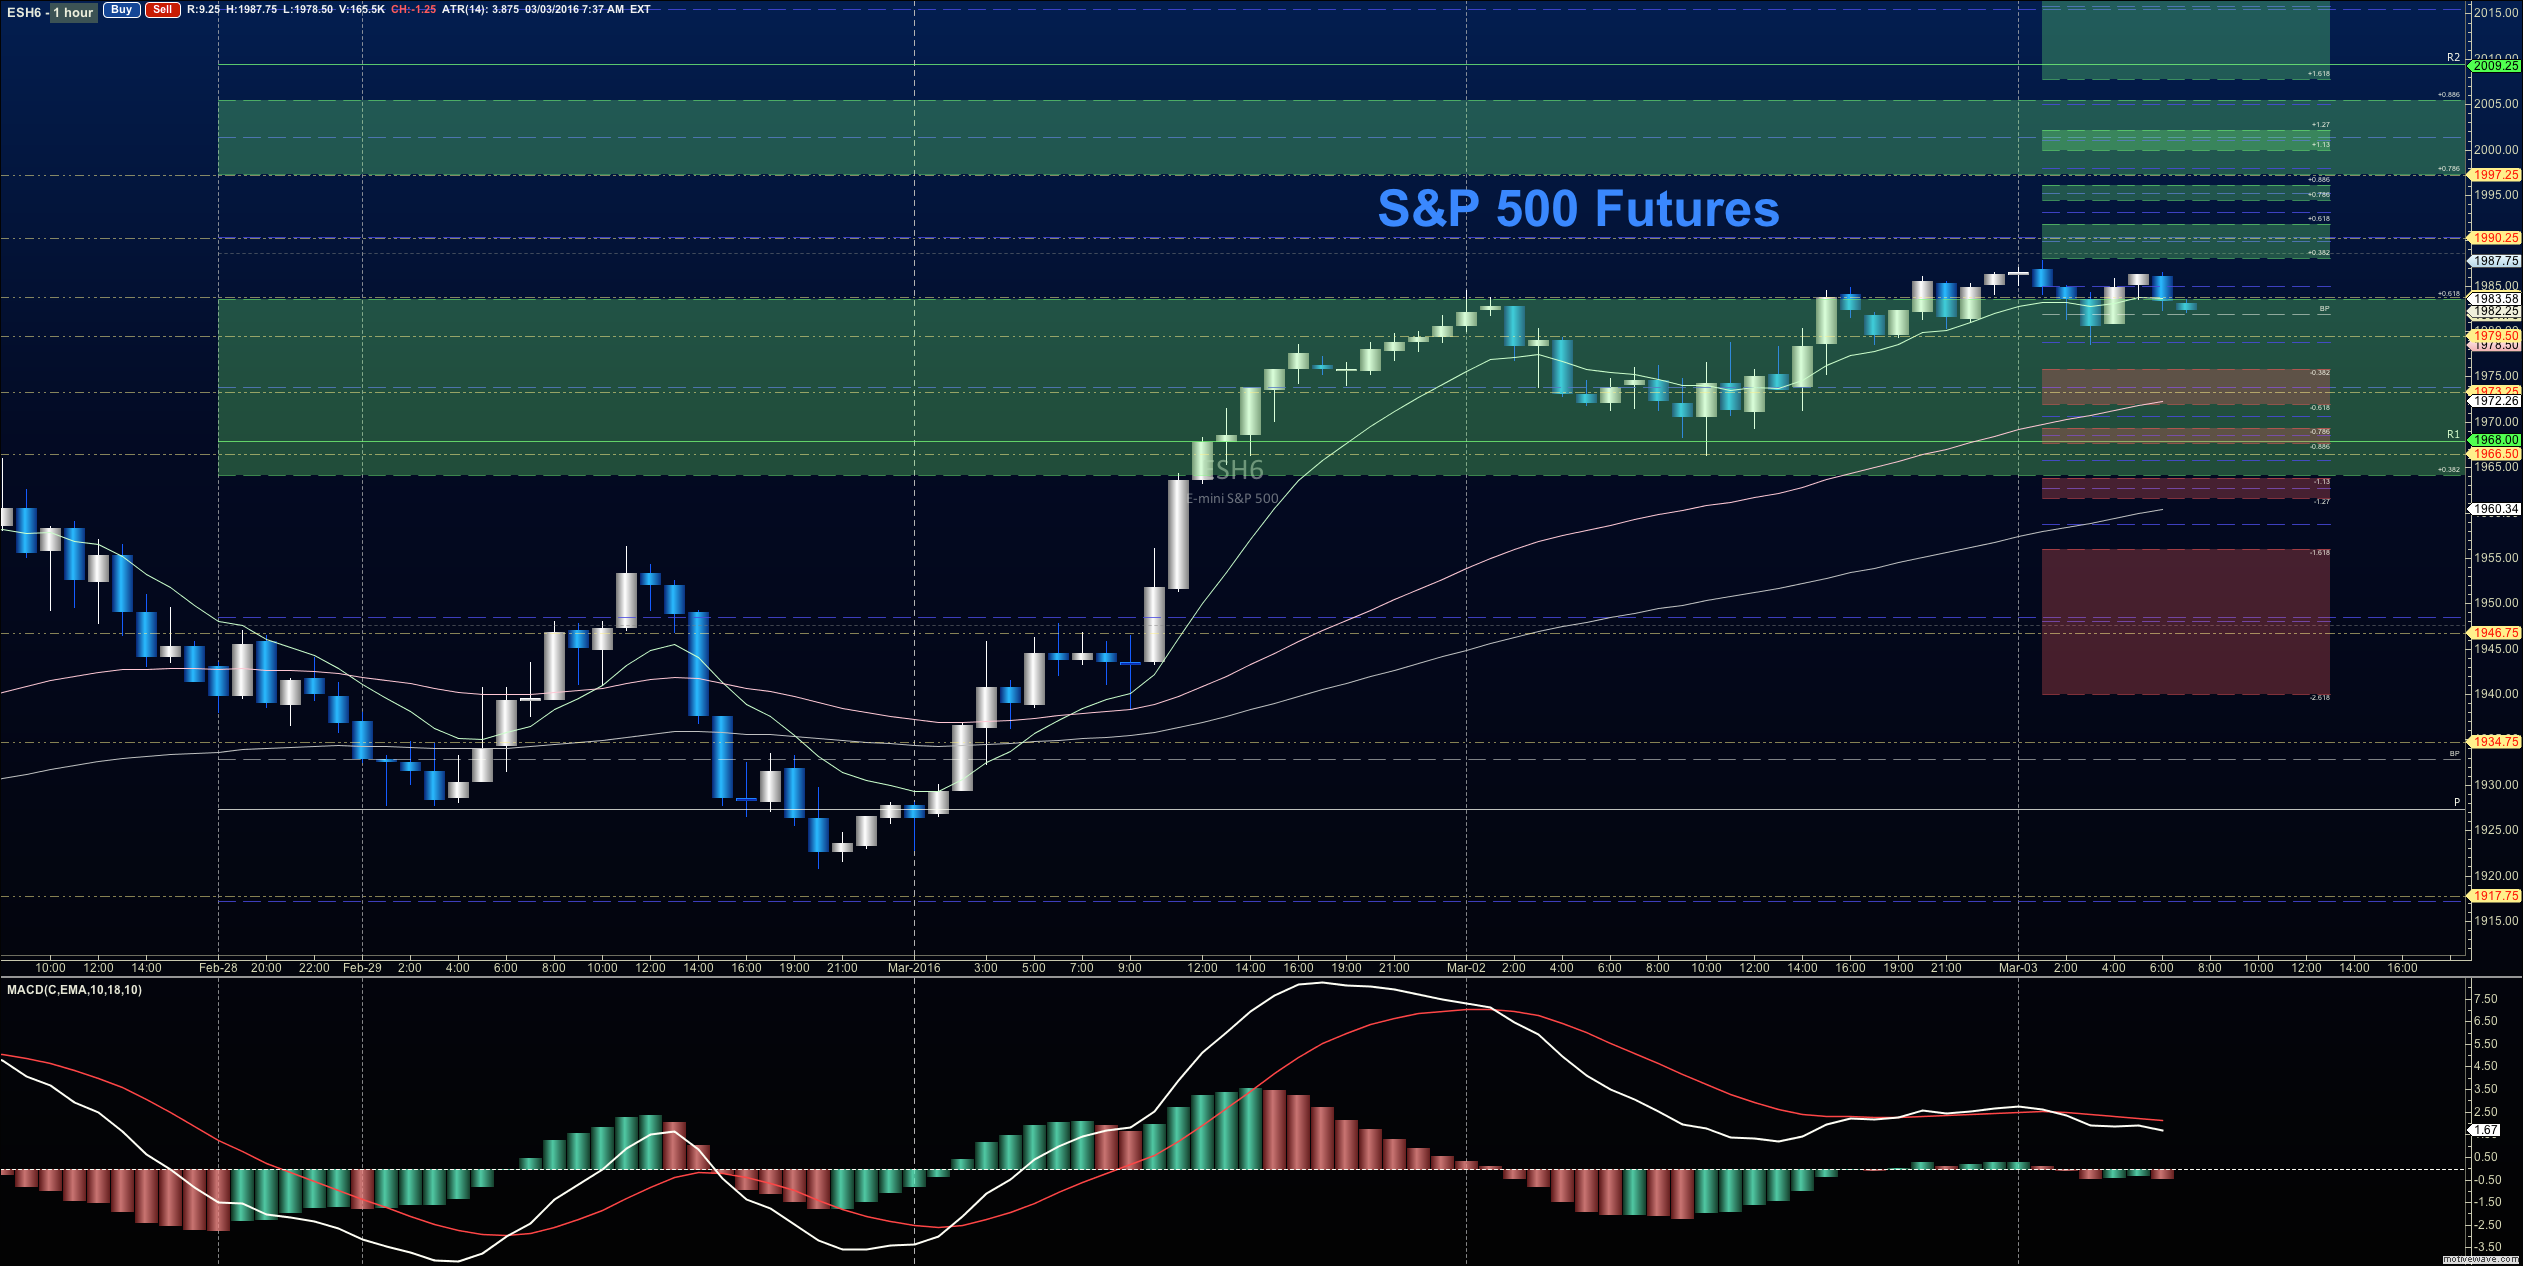
Overnight futures behavior has been very quiet. We retested the 1984 levels of yesterday’s resistance with divergent momentum. 1971-1974 remains a congested zone for S&P 500 futures and may provide support, else we have those levels near 1964 to look as targets. Again, this chart will be vulnerable to increased selling below 1977.5 if it does not quickly recover after losing the level.
Upside motion has the best setup on the positive breach and retest of 1987.75 or a successful retest of 1978.75. I use the 30min to 1hr chart for the breach and retest mechanics. Upside price targets on S&P 500 futures rangefrom 1978.75 are 1981.5, 1986.5, 1991, 1993.25, and if we can catch a bid there, we could expand into 1995.5 – 1998.75 and beyond. The next big resistance test sits at the region between 1996- 2011. Watch the higher lows to keep you on the right side of the long trade. Charts are firming up, but expect pullbacks into higher support. The shallower they are, the more likely the chart is to rise.
Downside motion opens below the failed retest of 1977.5 or at the failed retest of 1984.5 with negative divergence – but really watch for the higher lows there to tell you the short is ill positioned. Retracement into lower levels from 1977.5 gives us the targets 1974.75, 1971.25, 1968.75, 1964.5, 1961, 1956.75, and perhaps 1948.5 if selling really takes hold.
Have a look at the Fibonacci levels marked in the blog for more targets.
If you’re interested in the live trading room, it is now primarily futures content, though we do track heavily traded stocks and their likely daily trajectories as well – we begin at 9am with a morning report and likely chart movements along with trade setups for the day.
As long as traders remain aware of support and resistance levels, risk can be very adequately managed to play in either direction as bottom picking remains a behavior pattern that is developing with value buyers and speculative traders. Visit The Trading Vault to learn how to trade the way I do.
Thanks for reading.
Twitter: @AnneMarieTrades
The author trades stock market futures every day and may have a position in mentioned securities at the time of publication. Any opinions expressed herein are solely those of the author, and do not in any way represent the views or opinions of any other person or entity.

: Worrisome to Broader Market?")


