The decline we drew on the chart last week for the iShares Russell 2000 ETF (NYSEARCA:IWM) worked as expected. Price moved down into the indicated support area and even slightly lower before putting in a modest bounce.
Meanwhile, the SPDR S&P 500 ETF Trust (NYSEARCA:SPY) made a similar decline last week before putting in a substantially stronger bounce from support.
With SPY acting much more enthusiastic than IWM here, which index fund is the better harbinger of price action in coming weeks and months? We believe the answer resides in the structure of the move up from the SPY October 2023 low, and we’ll show you why.
The rally in SPY exceeded our expectations by making a new high over that of July 2023, and the form appears impulsive rather than corrective. In other words, it appears to be tracing a five-wave non-overlapping pattern. When the impulse is complete, a reversal of some magnitude (small or large) should occur.
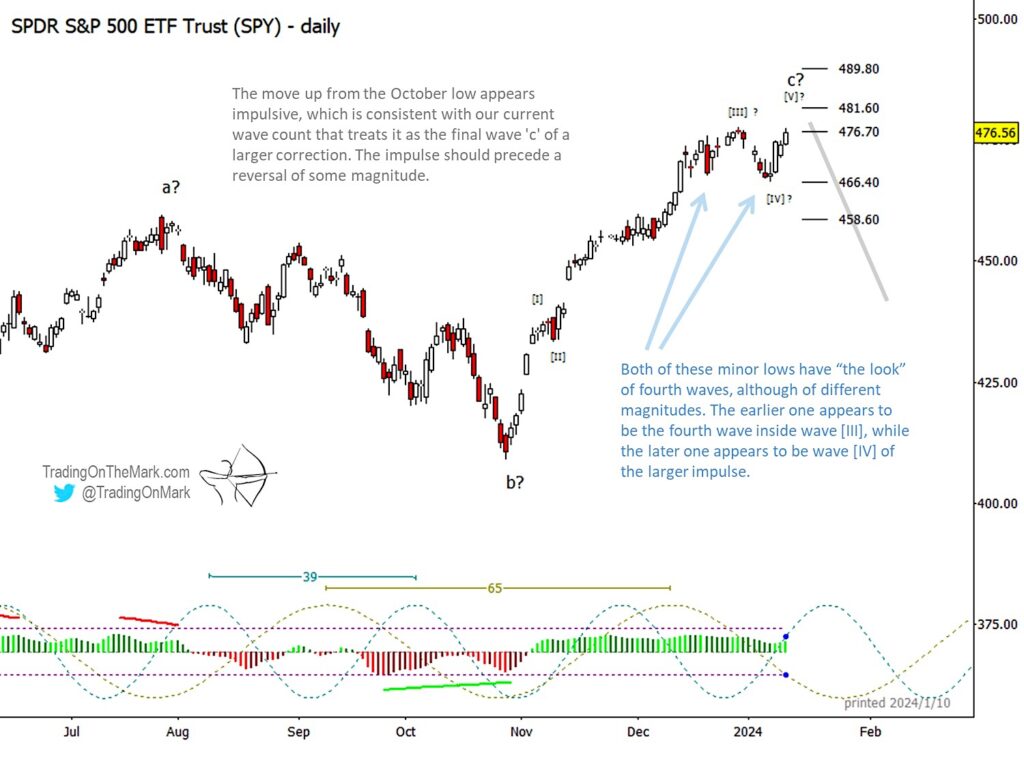
Some indications on the daily chart that the SPY rally might be running out of steam include:
- The structure appears to be impulsive, and thus we provisionally view each rise and decline since October in the context of an expected five-wave move. Currently the pattern appears to be in its fifth wave.
- There is some minor negative divergence between price and the momentum indicator.
- A peak in the dominant 39-day cycle is due soon.
- The two minor lows since December have “the look” of fourth waves in the Elliott wave
methodology.
Nothing on the daily chart is definitive in terms of saying a reversal is due, but there is some assurance to be gained from the combined presence of four different types of conditions – structure, momentum, timing and successive lows that found support near the same place.
These are the types of conditions an Elliott wave technical trader would watch when working on
a daily time frame.
The weekly chart below shows how the impulsive wave ‘c’ fits within our larger wave count. (Note that we revised the count since the publication of our SPY chart in early November. Our earlier count was made invalid when price exceeded the July 2023 high.)
Overall, the price action since the 2022 low can be viewed as either the start of a larger move upward or as part of the middle portion of a lengthy correction. Regardless of which interpretation is correct, the current move which we have labelled as wave ‘y’ of [b] appears nearly complete, and near-term bullish positions appear increasingly risky.
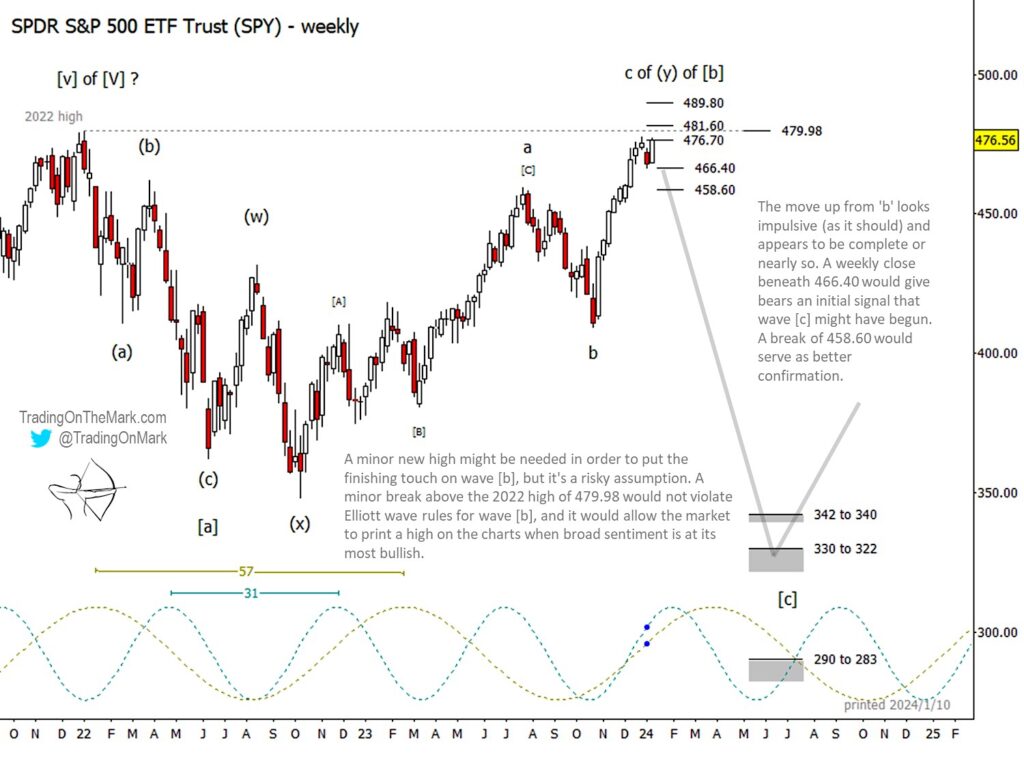
It’s important to note that a minor new high here would not invalidate our interpretation of the larger pattern as being a corrective ‘b’ wave. Instead, a minor breakout above the 2022 high at 479.98 might serve to draw in additional “dumb money” as market sentiment peaks just before a reversal. We note there are additional resistance areas nearby at 476.70, 481.60 and 489.80.
For traders operating on a weekly time frame, preliminary confirmation of a reversal would come with a weekly close beneath 466.40, which is the area where the sequential fourth waves on the daily chart found support. Additional confirmation would come with a break of support at 458.60.
If the larger reversal takes hold as we expect, then SPY might pay a visit to the areas near 340 or 330 later this year.
To kick off 2024 we’re offering an introductory special for new subscribers to receive our daily updates about equity indices, commodities, currencies and treasury bonds. Visit our website to learn the details and see a preview of our work.
Twitter: @TradingOnMark
The authors may have a position in the mentioned securities at the time of publication. Any opinions expressed herein are solely those of the author, and do not in any way represent the views or opinions of any other person or entity.
: Creating Bullish Divergence?")


 and Semiconductors (SMH): Concerning Price Pattern?")


