The impressive rally in stock indices in recent months has caused us to revise the Elliott wave count we posted here in September for the iShares Russell 2000 ETF (NYSEARCA:IWM). However the rally still appears to be part of a corrective [b] wave pattern that would precede a downward reversal.
When we wrote the September piece we were expecting a bounce in IWM. The bounce turned into something larger than expected though.
Looking at the market action with the benefit of hindsight, the weekly chart shows how price first broke beneath the supporting edge of the range and subsequently climbed back above the trendline. That failure by bears to hold their advantage was the first sign the corrective pattern might not yet be finished.
The subsequent rally corresponded with the bounce we were expecting, but it then went on to exceed the resistance areas we identified in the previous post, representing an additional setback for bears – probably only a temporary setback.
Now the rally has reached even above August 2021 high, but it also has reached a resistance zone that starts at 205.80. On a daily chart (not shown) there are structural exhaustion and momentum divergence signals suggesting the present leg of the rally might be over.
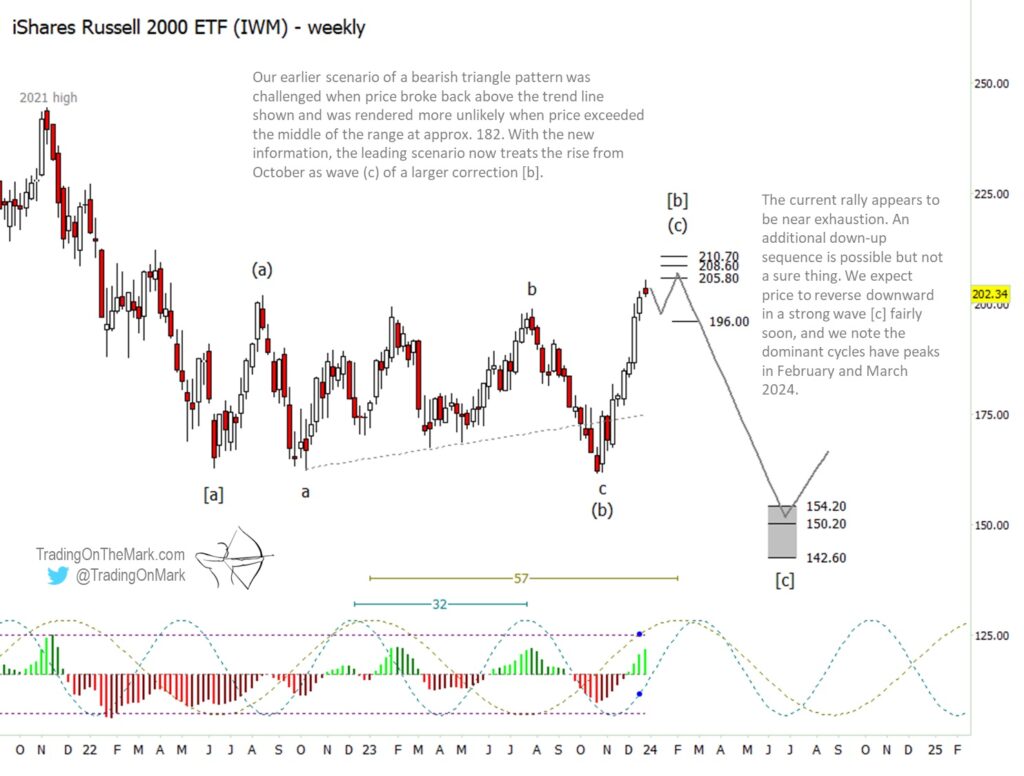
Treating the rally as wave (c) we expect it to consist of five sub-waves. It’s not clear whether the pattern has already put in all five waves, or whether another down-up sequence might be needed. If price were to find support after a small pullback here, then the area near 196 would be the first place to watch for a possible bounce. A break of that support would strengthen the case that the downward reversal has already begun.
Eventually the decline should reach beneath the lows of 2022 and 2023. We have indicated the fist major support zone in the region between 154.20 and 142.60, although it’s possible the decline could reach lower. We’ll be able to produce more precise targeting after some downward structure starts becoming apparent on the charts.
To kick off 2024 we’re offering an introductory special for new subscribers to receive our daily updates about equity indices, commodities, currencies and treasury bonds. Visit our website to learn the details and see a preview of our work.
Twitter: @TradingOnMark
The authors may have a position in the mentioned securities at the time of publication. Any opinions expressed herein are solely those of the author, and do not in any way represent the views or opinions of any other person or entity.

: Showing Some Signs of Emerging Strength")

