The bearish forecast for stock indices still appears to be on track, and we expect to see more declines going into spring 2024.
Our previous post covered the ETF analogue to the S&P 500 Index, and this week we examine the implications of an Elliott wave triangle pattern in the iShares Russell 2000 ETF (NYSEARCA:IWM).
In our methodology, market corrections always have an overall three-wave structure. There’s an initial move, followed by a middle period of consolidation or a test of ranges, which is then followed by a thrust out of the middle area. Sometimes the middle consolidation takes the form of five converging waves which we call a triangle.
Those guidelines are helpful, but they don’t always remove ambiguity from the wave counts. The weekly chart below shows two ways of interpreting the rangebound price action since June 2022. Our favored scenario is drawn with a gray path, and an alternative that might be slightly more bullish in the near term is shown with a green path.
Both of the scenarios shown here involve a triangle pattern located in the middle of a larger [a]-[b]-[c] correction. The difference lies in discerning where the triangle actually starts.
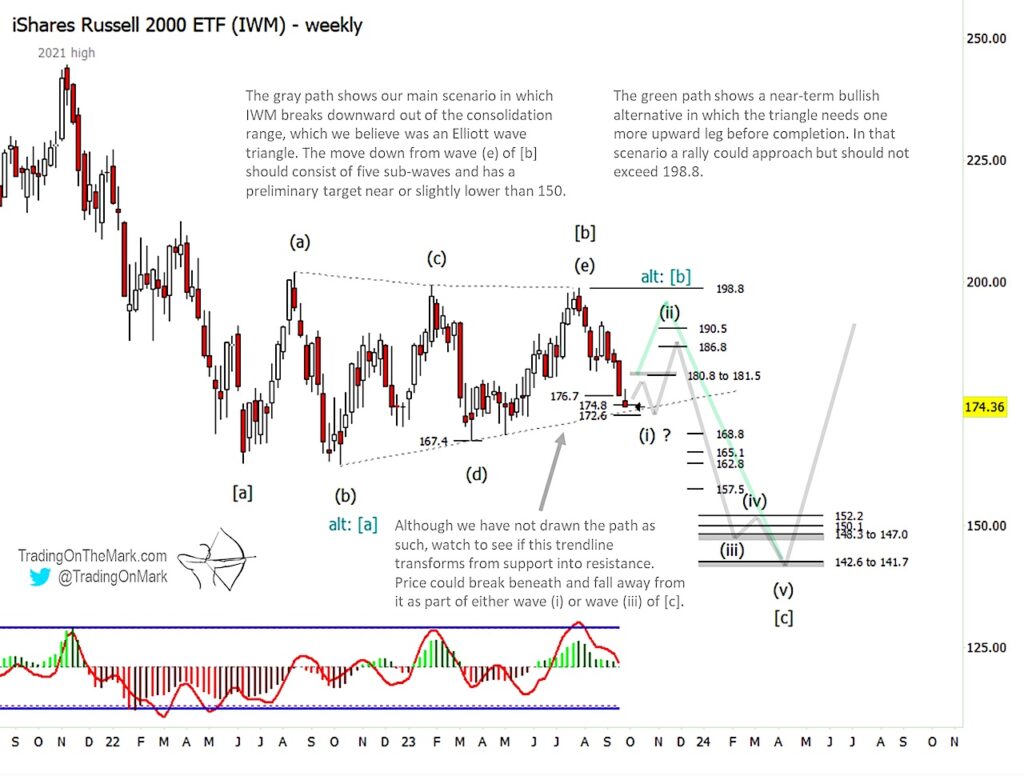
Our main scenario treats the entirety of wave [b] – all the price action from June 2022 low through the August 2023 high – as a triangle with sub-waves labelled as (a)-(b)-(c)-(d)-(e). In that view the triangle pattern is already finished, and bearish traders need only wait for price to break downward out of the range to complete wave [c] of the big correction as indicated by the gray path.
A near-term bullish counterargument is that triangle wave [b] might have started instead at the October 2022 low. In that view, the triangle needs one more leg up from near the present area before downward wave [c] can commence.
From the perspective of a trader working on daily or weekly time frames, there is little difference between the two scenarios. Both views have IWM currently trying to finish the decline that began in August, setting up a rally that could be either wave (ii) or the final wave (e) of the triangle. If a rally emerges from near the current area, it should end up producing a lower high compared to August.
Note, in either of the scenarios discussed here, a rally retracement could be either shallow or quite forceful. The only strict Elliott wave rule for this situation is that the rally should not exceed the August high of 198.8. A minor poke above that level would invalidate the idea of the rally being wave (ii), and a weekly close above that level would essentially invalidate the idea of a triangle. Breaking 198.8 would cause us to revise our larger wave count, although it wouldn’t necessarily be a big-picture bullish signal.
If stocks really are in a bear market as we believe, then traders should be mindful that any surprise moves generally will point downward. That suggests that anyone seeking bullish trades here should be nimble in terms of getting in and out near the most reliable support/resistance levels. The better opportunity for those not watching IWM on a daily or intraday basis will probably be to catch the next decline from a lower high, which would be downward wave (iii) in our main scenario.
Trading On The Mark uses technical analysis to identify the trends and turns in highly traded markets for commodities, energy, currency, bonds and indices. Visit our website for more charts, and follow Trading On The Mark for updates and special offers.
Twitter: @TradingOnMark
The authors may have a position in the mentioned securities at the time of publication. Any opinions expressed herein are solely those of the author, and do not in any way represent the views or opinions of any other person or entity.


