We believe the year-long rally in equities is nearing its end, and the declining phase of the pattern may already have begun. Here we examine two scenarios for a high nearby in the SPDR S&P 500 ETF Trust (NYSEARCA:SPY).
In the bigger picture, price action since the January 2022 high appears overall corrective. Seen through Elliott wave methodology, the pattern isn’t finished yet because it has not produced an impulsive (five waves) move into a low. Instead we believe the index is trying to complete the middle [b] wave segment of an [a]-[b]-[c] formation.
If this is correct, then the next low should reach near or perhaps slightly beneath the lows of 2022 before another recovery phase can begin.
Looking at the weekly and daily charts, the main question for traders is whether the climb from March 2023 represents a completed wave ‘c’. Provisionally we believe it counts as complete, and that’s the scenario drawn with the gray path. An alternative wave count would call for one more new high over that of July, as shown with the green path.
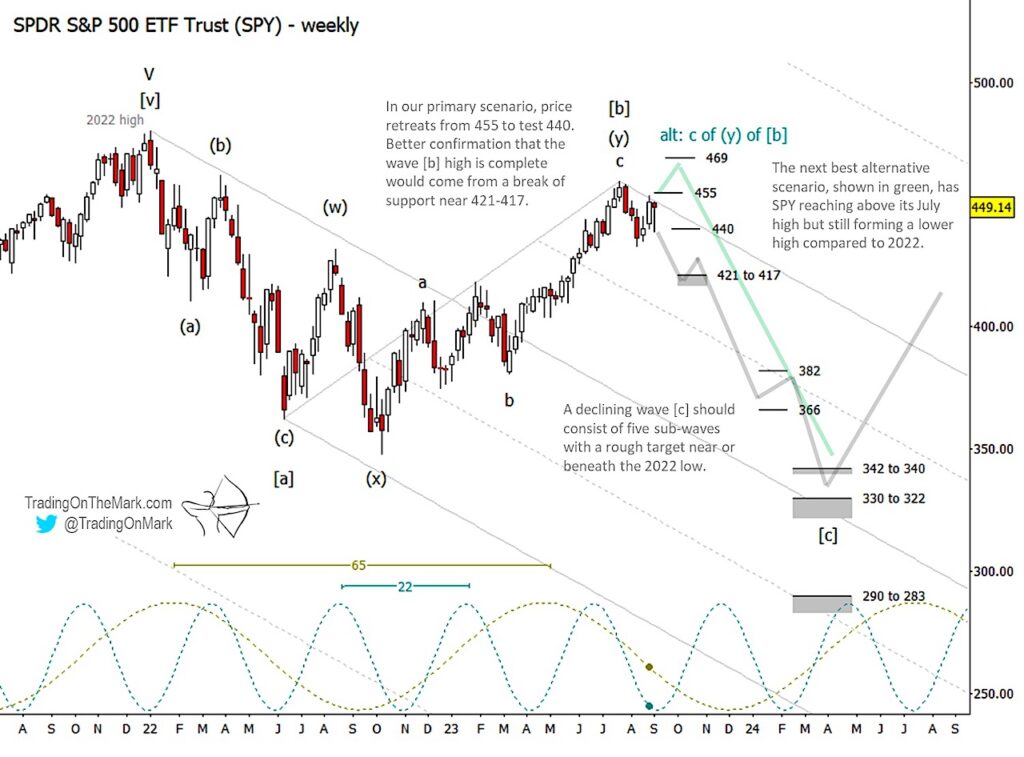
If price retreats forcefully from resistance near 455, it would encourage market bears with the prospect of a downward cascade from a lower high. A break of support at 440 would allow for a test of the zone near 421-417, at which point the big decision happens. We can’t be confident in ruling out another high until the latter support zone breaks.
Alternatively, if price pushes above 455 it will allow an attempt to reach Gann-related resistance at 469. That would still represent a lower high compared to 2022 though, and it would still be followed by a strong downward wave [c].
The eventual target zones for the decline await near 342-340 and 330-322. A stretch target also sits near 290-283, but we believe the move is unlikely to extend that far.
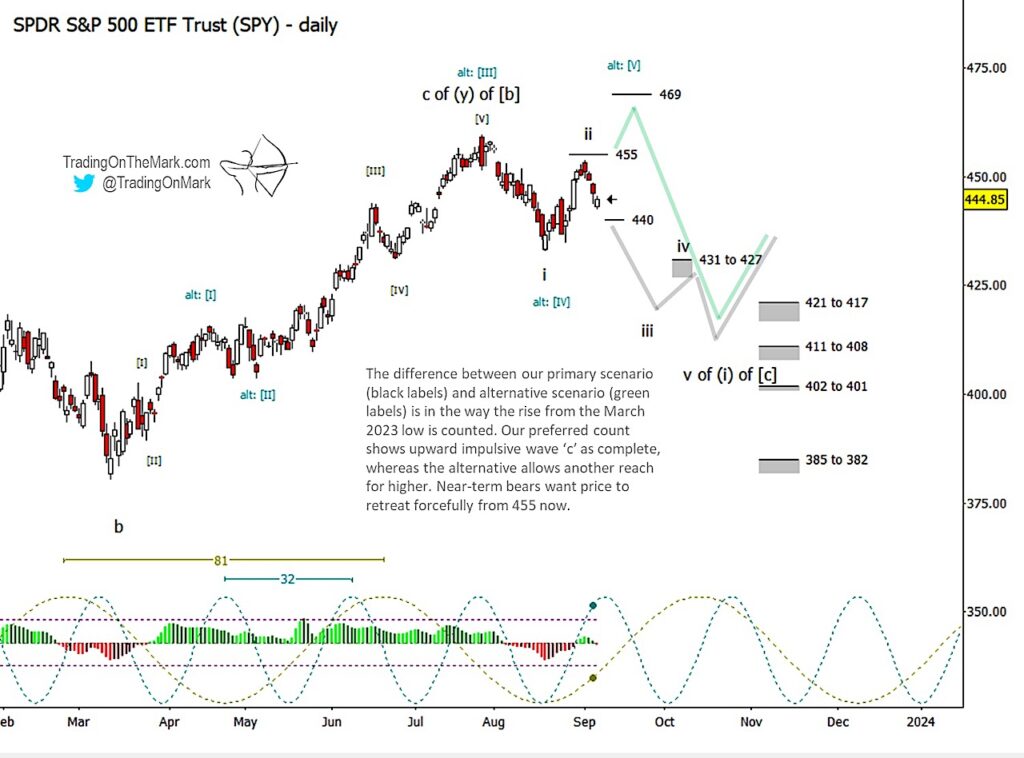
The daily chart shows the two competing ways of counting the move up from the ‘b’ low in March. Even though we slightly favor the more bearish count with the black labels, the alternative count with green labels produces some nice Fibonacci relationships among the sub-waves.
We also note there isn’t yet a divergence signal on the CCI momentum indicator, and that should introduce some caution for near-term bears. The case for downward will be made stronger by a forceful break of support at 446 and/or the development of termination signals such as divergences.
Trading On The Mark uses technical analysis to identify the trends and turns in highly traded markets for commodities, energy, currency, bonds and indices. Visit our website for more charts, and follow Trading On The Mark for updates and special offers.
Twitter: @TradingOnMark
The authors may have a position in the mentioned securities at the time of publication. Any opinions expressed herein are solely those of the author, and do not in any way represent the views or opinions of any other person or entity.


