Will S&P 500 remain below the summer high?
Trading On The Mark
When we last wrote about the S&P 500 ETF (NYSEARCA:SPY) in early September, it was unclear whether the index needed another minor high this year to complete the pattern segment. The overall bearish action in recent weeks has taken price down as far as it could go while still leaving the question unanswered. Our overall outlook for the index remains bearish for 2024.
Our preferred count would have SPY put in a lower high compared to that of July, and then to make a quick resumption of the downward trend going into next spring. On a weekly time frame, as shown below, a test of resistance near 440 or 449 would be reasonable in that scenario.

The alternative path shown in green envisions a corrective [b] wave that isn’t yet finished. In that scenario a minor new high over that of July would suffice before bears take their turn. Reasonable targets for the higher high include 460, 464 and 468.
If our primary (gray) scenario is in play, it will be interesting to see whether SPY can stay within the provisional channel drawn on the weekly chart.
The corresponding daily chart also shows the two alternative paths. Traders might note how price behaved upon tests of the support zones we identified in the previous post, as those could have made for some excellent short-term trades. Often the support and resistance zones work regardless of which wave count is primary.
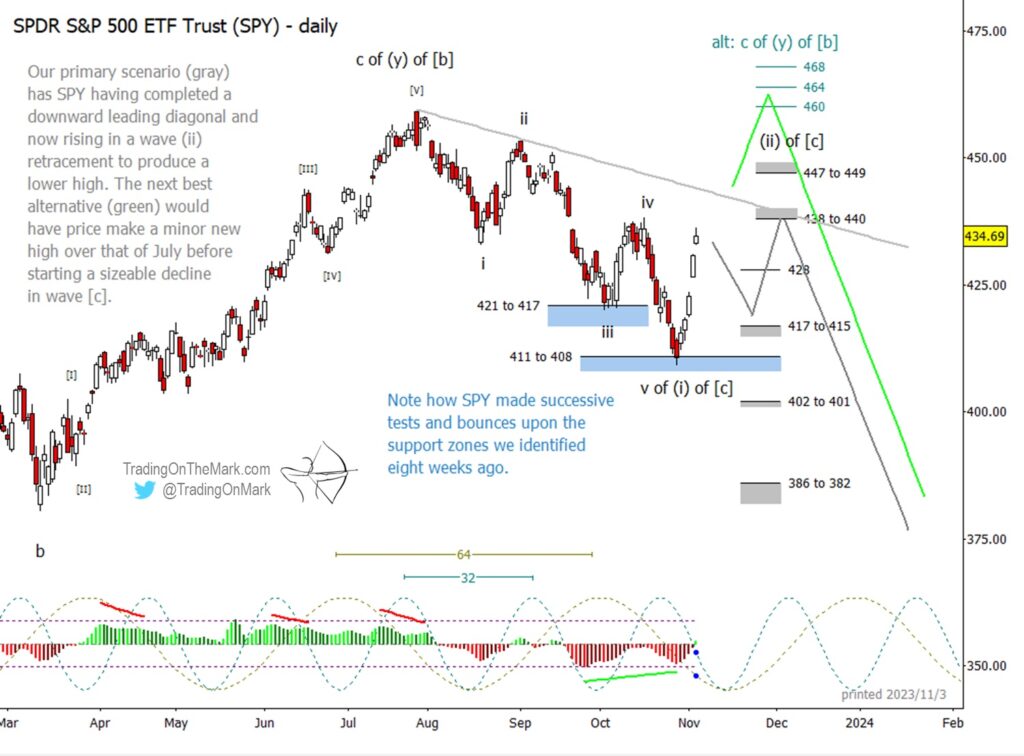
To our eye, the two most prominent cycles on a daily chart have periods of 64 and 32 days. We note that both of those cycles have an inflection around the middle of November, although it’s quite possible the inflection could manifest as a local price high rather than a price low. If it turns out to be a local low, then the date could mark a secondary bounce that would still be part of upward wave (ii).
Trading On The Mark uses technical analysis to identify the trends and turns in highly traded markets for commodities, energy, currency, bonds and indices. Visit our website for more charts, and follow us on X for updates and special offers.
Twitter: @TradingOnMark
The authors may have a position in the mentioned securities at the time of publication. Any opinions expressed herein are solely those of the author, and do not in any way represent the views or opinions of any other person or entity.


