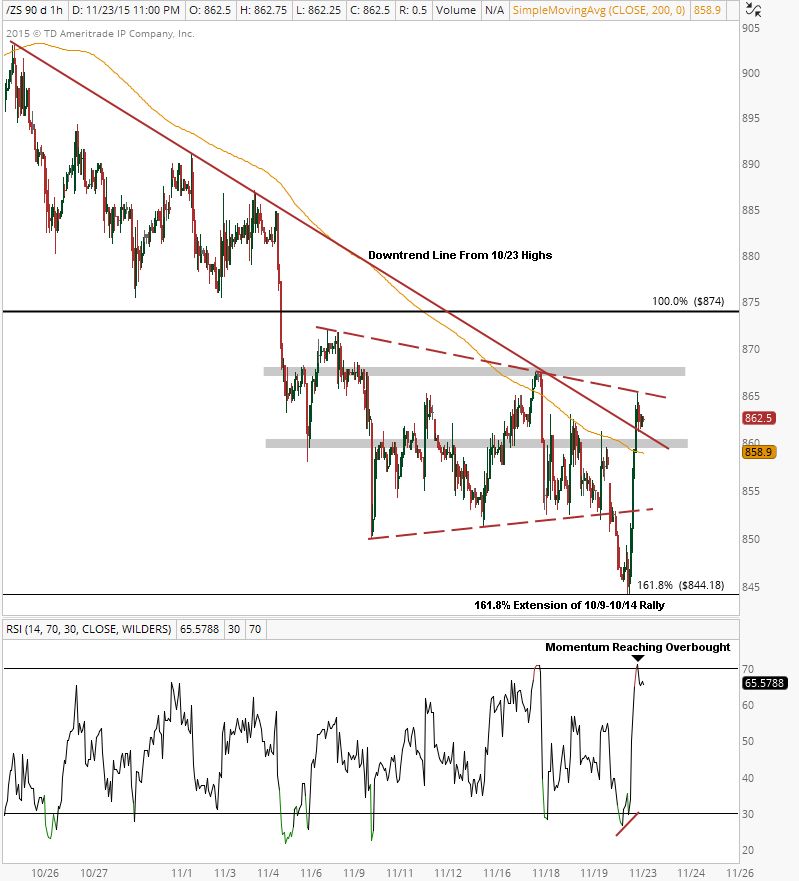
This aggressive rally allowed prices to break above the congestion area around $860 and the downtrend line from the late October highs with momentum reaching overbought conditions.
The major issue here is that the 200 hour moving average is still downward sloping, which poses a major headwind for prices.
If soybeans prices can consolidate in the upper part of this range and hold above the broken downtrend line and prior resistance at $859 to allow the 200 hour moving average to flatten out and begin rising, that would be a major tailwind for prices. Following that development, a breakout above $868 would confirm a breakout and warrant getting involved on the long side.
Soybeans Hourly Chart
The Bottom Line: With sentiment as pessimistic as it is and price action improving, it may be time to look at Soybeans on the long side. Monday’s reversal was a step in the right direction, but Soybeans bulls will want to see prices consolidate above $859 for a few days to allow the 200 hour moving average to begin rising before looking to get involved with the Soybeans mean reversion trade.
From a risk management perspective there is no reason to be long this market unless we close above the confluence of resistance at $868. In the event that the conditions discussed throughout the post do develop, longs can use prior support near $900 and the 200 day up near $930 as Soybeans price targets and points of reference.
As always, if you have any questions feel free to reach out and I’ll get back to you as soon as I can. Thanks for reading.
Twitter: @BruniCharting
Trader does not have a position in the mentioned securities at the time of publication. Any opinions expressed herein are solely those of the author, and do not in any way represent the views or opinions of any other person or entity.


: Showing Some Signs of Emerging Strength")
