Events such as tax deadlines, holidays, options and futures contract expirations, the opening and closing bell, index changes, earnings, elections, earnings seasons and tax-loss selling all have an influence on traders and investors.
Markets, sectors and individual stocks have all shown a tendency to post annual highs and lows around the same time every year.
This cycle is known generally as market seasonality.
By far the most popular and perhaps oversimplified seasonal trade is the one behind one of the most overused market adages, “sell in May and go away”.
On average, stocks rise in the spring and are weak in the summer and early fall, only to witness a year-end rally that usually extends into January. In most years the November-to-January period tends to be the best three-month holding period for the market. It’s a simple premise, but not so easy to follow.
The goal is to find anomalies to try to outperform either by taking part in or avoiding a repeat event. The problem is that sometimes it works, and sometimes it doesn’t. Let’s examine how this approach would have performed this year.
Sell in May and go away?
Charts 2 and 3 show both the S&P 500 and S&P/TSX Composite performance year to date compared to the average yearly performance going back to 1990. Not surprisingly, 2019 has been above average in terms of returns, but it should be taken in context considering the sell-off last December. Since the end of April, the S&P 500 is up 1.93% and the S&P/TSX Composite is up 0.89% – not great but at least not negative.
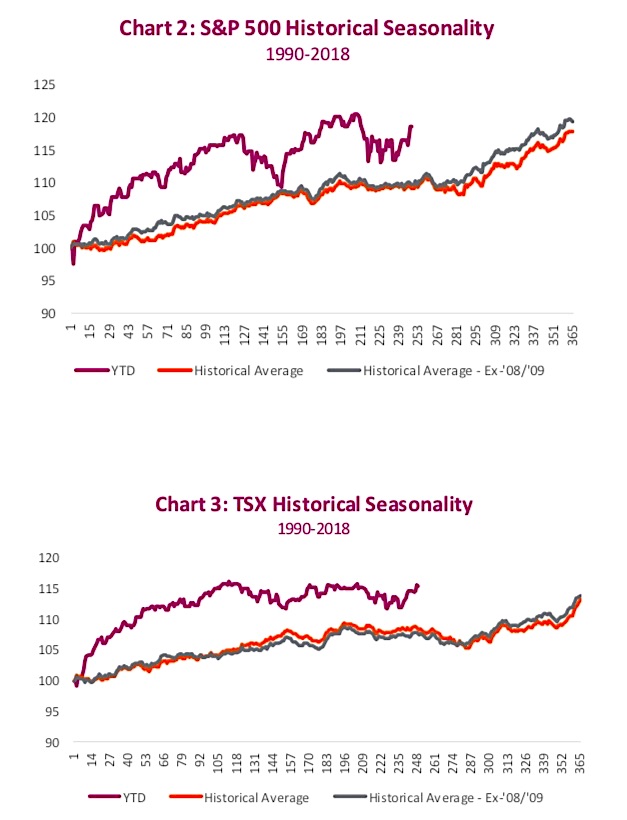
However, if you had sold and bought all bonds, you would be better off. The FTSE TMX Universe Bond Index is up over 4% over that same time period. Maybe the classic rhyme has a point. The month isn’t over and one good week doesn’t guarantee a great month. Based on our historical analysis, the market isn’t quite out of the seasonal weakness. But the good news is that the best seasonal buying opportunity is not far off the horizon. Or is it?
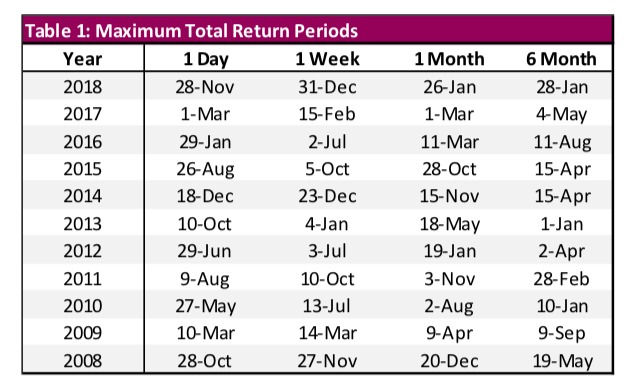
Individual time horizons also play an important part in determining when it’s a good time to buy. Table 1 shows the best day in each calendar year to invest in the S&P 500 based on your time horizon. (1 day to 6 months) Can you spot any seasonal trends? We didn’t’ think so.
Portfolio implications
While there are cyclical influences on stocks, it’s important to remember that the market is never the same as it was in the past; it differs because of fundamental and psychological considerations. Sometimes recognizing when markets are ignoring seasonal trends can be just as important as trading them. Right now, markets are simply behaving the way they are supposed to be. Just because September is off to a great start, there is little reason to overthink it.
We expect bouts of volatility to be a recurring event in the months to come, given the importance of central bank policy adjustments, a Canadian election, Brexit and the all-important trade war. It would seem at times that seasonality has nothing on the power of a single tweet.
Although economic cycles, political climates and public markets are constantly changing, the behaviour patterns of humans remain the same. We spend a considerable amount of time studying both the markets as well as human behaviour and humans can be foolish.
Overreacting to news events and earnings, as well as behaving one way based on certain circumstances during some parts of the year and completely differently in other parts of the year. Investors it would seem are most predictable in their unpredictability.
Source: All charts are sourced to Bloomberg L.P. and Richardson GMP.
Twitter: @ConnectedWealth
Any opinions expressed herein are solely those of the authors, and do not in any way represent the views or opinions of any other person or entity.


