The following was written by the Richardson GMP Asset Management Team: Craig Basinger (CIO), James Price (Director), Gareth Watson (Director), Chris Kerlow (PM), Derek Benedet (Analyst), Shane Obata (Analyst), and Joey Mack (Director).
This bull market is like a fine wine that keeps getting better with age. In its eighth year, most markets experienced double digit returns. Moreover, earnings growth has returned and there is a renewed sense of optimism for the global economy.
The U.S. markets are at all-time highs while Canada is a stone’s throw away. Bonds sold off, but with credit spreads narrowing, the damage was limited. Commodities posted their first yearly gain in the past six. The market is giving OPEC and Donald Trump the benefit of the doubt. OPEC said that it will follow through with promises to cut production, Donald Trump said that he will enact market-friendly tax and regulatory legislation. As we roll into 2017, the glass appears half full.
Highlights:
2016 – An American classic – A closer look at the year that was.
Economically, the cycle is strong – The data globally has been improving over the past six months and our market cycle model continues to favor a continuation of the current cycle.
Deflation to reflation – If bond yields continue to rise then deflationary strategies that worked in years past are in trouble, while reflationary strategies will be the winners.
Bring on the big “G” – Populist votes are triggering many governments to back off austerity and to turn on the government spending taps.
Is it finally time for the return of Capex? There are many positive indications that we could see a strong rebound in capex this year.
2017 earnings tempest – The stage is set for the strongest earnings growth in years.
Investment risks for 2017 – Three things to watch out for this year. Bond market – Higher yields, tighter spreads, defaults rising, lots of moving parts.
The Dollar – Still some upside, but most of the easy money has been made.
2016 – An American Classic
If last year was a movie or piece of literature, it certainly would have fit the mold of most American classics. The first half was filled with tragedy, including a global market correction, weak economic data and wildfires in Alberta, culminating in a surprise Brexit vote. The second half was filled with underdogs coming from behind and winning. Trump fits this mold, as does the TSX, which was the strongest performing index among developed markets, after years of being at the other end of the spectrum. When all was said and done, 2016 clearly had a happy ending for most markets participants.
The TSX Composite led the way this year, rising over 20% and getting close to the all-time high set back in 2014, before the collapse of energy. This impressive advance was fueled most by the Financial, Materials and Energy sectors. The S&P 500 (INDEXSP:.INX) managed to gain over 10% in 2016 and was busy making new all-time highs. Energy and Financials were the leaders in America. For the first time in three years, currency was a drag on U.S. denominated assets, as a very volatile C$ ended the year a bit stronger than it began.
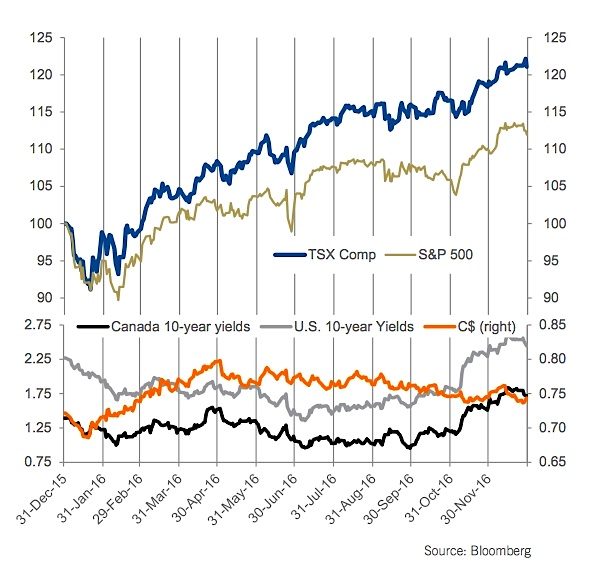
The bond market enjoyed solid gains in the first half of the year and weakness in the back half. All said and done, the broader bond indices still managed to post small single digit returns for the year. Other notables included oil rising 45% to over $50/bbl. This helped the broader CRB Commodity Index rise 9%, ending a streak of five consecutive down years.
The current bull market cycle will turn eight years old this coming March, getting old by most historical measures. Late cyclical sectors led the markets higher in 2016. We also have the Fed tightening monetary policy, bond yields rising and signs of inflationary pressures – all common characteristics of the latter stages of a bull market. On the positive side, earnings growth has returned and economic activity is picking up, which could support another year or two of good times for this cycle.
Deflation to Reflation
What if bond yields, measured by the 10-year U.S. Treasury (INDEXCBOE:TNX), rise to 3%? Six months ago, when yields were fetching a mere 1.4%, you would have been laughed out of the room for even asking the question. Now, with yields at 2.45%, folks are taking notice. This isn’t just a North American story: bond yields have been rising over the past six months around the globe. There are a number of contributing factors to this move higher in yields. At the starting point, perhaps the flight to safety following the surprise Brexit vote pushed yields to artificially low levels. Follow this with improving economic data in most jurisdictions around the world and rising intentions of fiscal spending to foster more growth. Or, maybe it is as simple as after a 30-year bull market for bonds, they had given as much as they could.
We are not delusional enough to make any grandiose call about the end of a secular bond bull market. We also acknowledge that there are long term demographic and inflationary trends that put downward pressure on yields. However, at this point in the cycle, the most likely path for yields in 2017 is higher and could remain so until the next recession or growth shock.
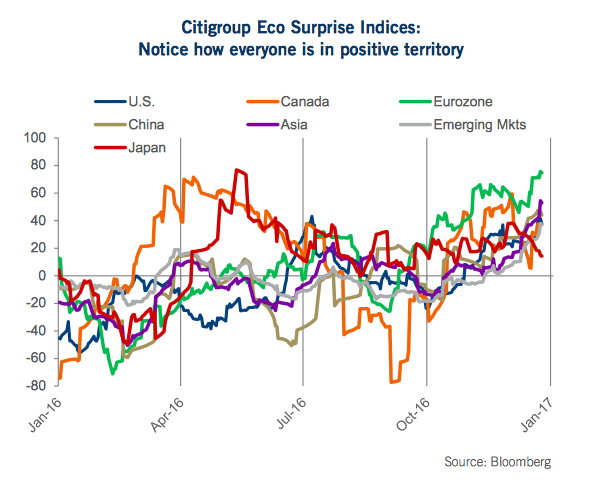
Economic data: It is rare for us to see the all seven CitiGroup Economic Surprise indices in positive territory at the same time (top chart). There is little 60% doubt that the economic data is coming in hotter than economists have been forecasting. Other forward looking measures, such as leading indicators and purchasing manager indices are also largely positive and rising. At this point, the global economic growth is on the rise.
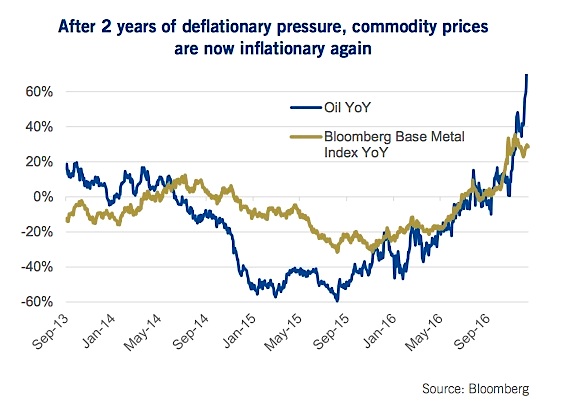
Commodities: It is not lost on us that yields continually moved lower from mid-2014 to mid-2016, during which time commodity prices were moving lower as well (2nd chart). Oil and base metal prices sat in negative year-over-year territory for two years, and this did suppress yields. Today, however, is the opposite. Oil prices are 70% higher than a year ago and base metals are up 30%. This certainly contributes to higher yields and higher prices.
continue reading on the next page…


: Showing Some Signs of Emerging Strength")
