Labor
The unemployment rate in the U.S. is 4.7%, the lowest in many years and near the trough during the last economic expansion. While we could debate the efficacy of this measure, given declining participation rates and other factors, there is little doubt that, at this level, wage pressures are sure to follow. We are starting to see this in the Atlanta Fed Wage Growth Tracker, which is at almost 4% (see chart to the right).
![]()
We do not believe bond yields are going to run away on us. A chunk of the uptick in inflation data came from housing rental costs and health care, both of which appear poised to normalize in the coming years because of changes to the ACA and rising home construction activity. However, we would not be surprised to see a 3%+ yield on the 10-year Treasury in 2017 and that carries a number of implications. The markets have spent a considerable number of years with declining or excessively low interest rates. As this deflationary world transforms into a reflationary one, certain business models and investment strategies will be tested. Understanding these changing risks will be critical for investment success in the years ahead.
Economically, the Cycle Is Strong
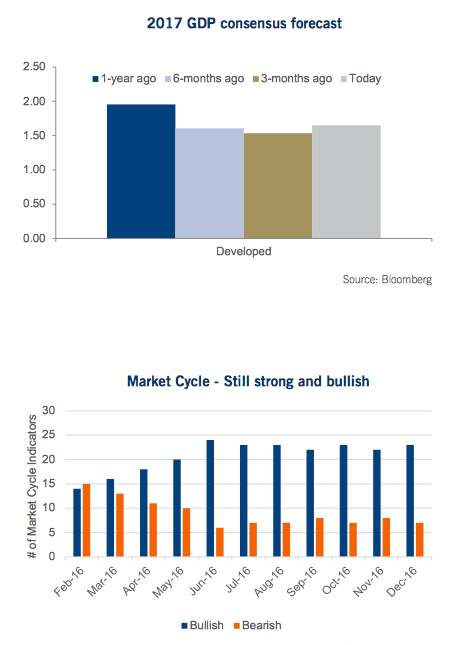
There is no question this has been a rather challenged economic cycle that has seen fits and starts, creating a global economy that seems to just be trundling along. The U.S. economy, one of the stars, has averaged just under 2% growth since 2009. Other major economies have not been as fortunate. But, something interesting has started to occur. GDP forecasts have gone up. Now we don’t want to jinx it, as the norm over the past five years has been for GDP forecasts to be set and then to be gradually revised lower. However, in the last three months we have seen developed economy GDP forecast for 2017 revised higher from 1.54% to 1.73%.
Looking beyond the consensus forecasts for GDP, our Market Cycle framework also supports a pretty healthy global economy. For those that have not seen our Market Cycle approach, this helps guide our asset allocation and is a strong input into our portfolio management. The basis for the Market Cycle is that, if you can ascertain in which phase of the market cycle you are currently, it helps tilt asset, geographic, active/passive and style allocations. However, ascertaining which phase of the cycle you are in is not an exact science and we use a multitude of models and indicators, about 30. These models are cross-disciplinary and include interest rates, fundamentals, momentum, valuations and economic variables. Currently, 23 of the 30 are bullish, supporting a continuation of the current market cycle.
While the economy is always subject to change, given the current momentum, we continue to believe the expansion will continue into 2017.
Bring on the Big “G”
Brexit, ‘No’ in Italy, Trump and the list goes on. Populist votes are winning against the establishment. People want change and much of this harbors back to a lack of growth and opportunity, whether real or perceived. This has triggered a global change in attitude from ‘austerity’ to improve the country’s balance sheet and to better prepare for the next financial crisis to growth. IMF data indicates that the peak years for fiscal austerity were 2011 to 2013. Austerity has been gradually diminishing ever since. The UK government has thrown out its objectives and Japan is turning on the fiscal taps. Europe appears more pro-government spending. And, of course, Trump wants to spend, spend, spend.
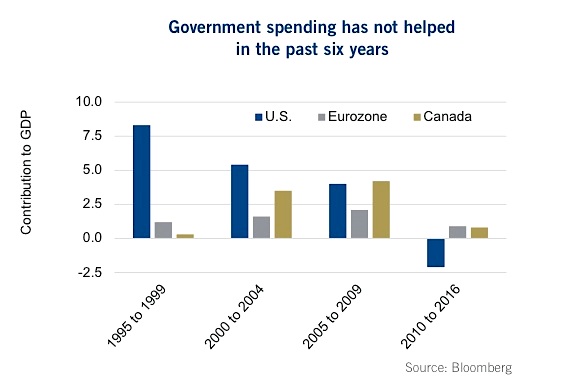
The chart on the right is the cumulative government contribution to GDP over five year periods. Since 2010, government spending has done very little to help foster economic growth and, in many of these years, was a drag on the economy. This is in stark contrast to previous periods in which the government was a positive contributor. If that does begin to change, as governments are beginning to pledge, this headwind could quickly become a tailwind for the various economies. Ok, perhaps the word ‘quickly’ should not be used. It does take time to implement government spending, but it does appear to be coming.
2017 Earnings Tempest
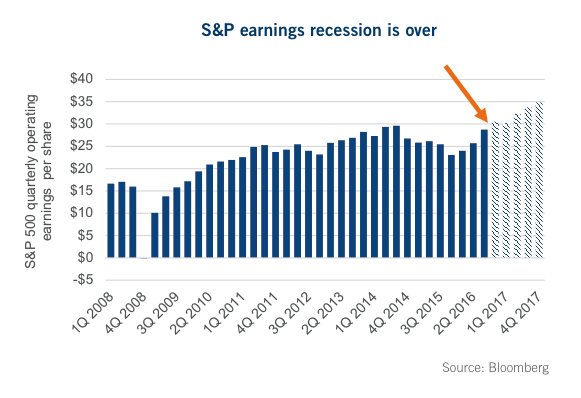
The S&P 500 generated $109 of earnings in 2016, assuming the Q4 earnings are roughly in line with expectations. That is better than the $101 $25 generated in 2015 but still short of the $113 from 2014. One thing is apparent, the earnings recession delineated by seven consecutive quarters of negative earnings growth is clearly over. And, while consensus expects a monstrous $131 of earnings in 2017, literally anything is possible. There are a number of factors that could really have a big impact on earnings, fortunately most of them are positive.
The earnings contraction of past years was driven by slow global growth, a collapse in energy corporate spending and a strong US dollar. We now have global growth rising and energy spending appears to have bottomed, with some early signs of resuming growth. The dollar is still a headwind but it hasn’t been rising nearly as fast as it did in past years. Recently interest rates have increased, which is a double-edged sword. In the near term, it is all good for earnings, notably among the Financial sector. Longer term, it will weigh on company finances, but that is a 2018+ issue.
However, the biggest wildcard is tax and other initiatives by the newest U.S. government. There has been talk of walking back regulations that impede growth, which sounds like a positive for earnings. There is also talk about repatriating offshore capital, which could be very positive for earnings or at least dividend distributions. Then there is talk of reducing corporate tax. Corporate tax rates are already coming down thanks to an accounting standard update that reclassifies excess tax benefits tied to stock compensation from shareholder equity to the income statement. This will improve the cash flow for a number of companies.
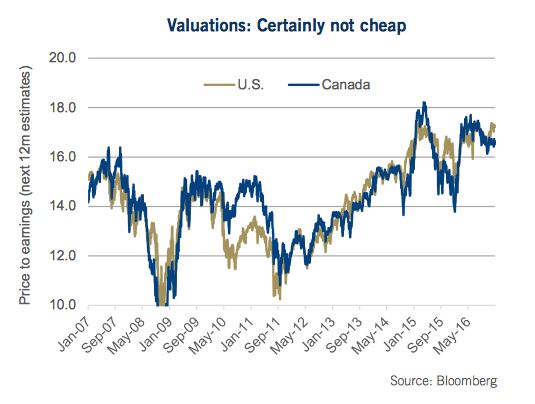
This could be a big earnings year, likely a record. Which is good, since the market is trading at a somewhat elevated valuation. The S&P 500 is 17.3x 12-month forward consensus earnings and the TSX is 16.6x. We believe it would be difficult to see this multiple increase in 2017, given rising bond yields, which tend to cause the market multiple to compress. So it is all up to earnings growth to offset any multiple compression and deliver positive returns.
If pressed with the question as to where do we see things 10.0 going this year – our answer is higher. Earnings growth is a huge positive and that should be enough to keep the S&P 500 continuing its bull market into 2017. However, the likelihood of a sharp multiple contraction (read correction) due to higher bond yields has become increasingly large. And, it will likely be swift. One day we will wake up and the market will all of a sudden care about the impact of higher yields. While we don’t know what day that will be, we would view it as a buying opportunity, given earnings growth, the economy and a host of factors that continue to favor a continuation of this bull.
Is it finally time for the return of Capex?
Private non-residential fixed investment may not sound like an important line in the quarterly GDP report, but investors ought to take notice. This is what corporations spend on capital expenditures (capex) and its trajectory has a number of -10% implications. The most logical aspect is, if companies are -15% confident enough to spend money to expand capacity then they are seeing rising demand and/or bottlenecks in meeting this demand. That is clearly a good sign for an economy as it means growth. Spending more on capex would be in stark contrast to corporate behavior over the past five years, which has seen companies opting to focus more on increasing dividends or share buybacks instead of capex.
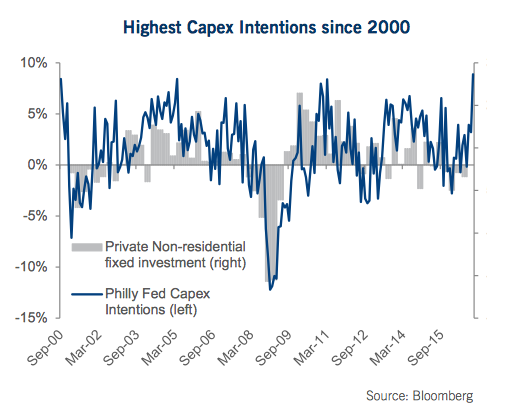
One of the more reliable leading indicators for capex is the Philly Fed Capex Intentions Index, which just reached the highest level in over 15 years (chart). Add to this the potential moves by Trump to lower corporate taxes, reduce regulation and even allow for the repatriation of cash held overseas by corporations, 2017 may see a binge in capex and even M&A activity.
This would all be positive for much of the Industrials and Technology sectors. Investors should also note that S&P 500 earnings are especially sensitive to capex, meaning this may accelerate the earnings growth in the coming quarters.
continue reading on the next page…


: Showing Some Signs of Emerging Strength")
