When we last wrote about treasury bonds for See It Market in September, we suggested that treasury bonds were on the verge of turning bearish. Shortly after that post, the iShares 20+ Year Treasury Bond ETF (NASDAQ:TLT) fell through the initial support area as expected, and it is now approaching the first major target area.
Today we’ll discuss this and highlight some TLT lower price targets.
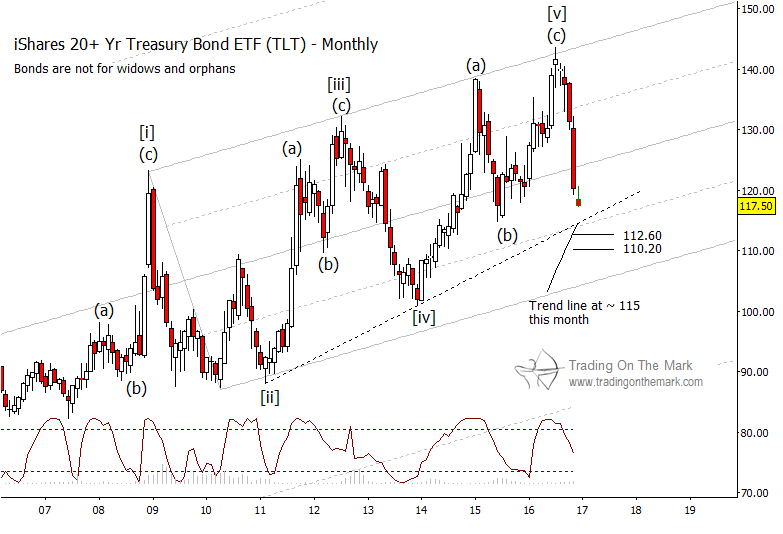
Even if the downward move was not surprising, its power was remarkable. Coinciding with the evening of the U.S. election, the treasury bond ETF (TLT) plummeted beneath a prior area of consolidation and has kept moving lower since then.
As TLT gets ready to test the next area of supports (and initial TLT lower price targets), traders who took advantage of the decline should now be watching for signals that they should take profits. In particular, we will be watching a trend line that connects prior lows on a monthly chart, as well as Fibonacci-related price levels near 112.60 and 110.20.
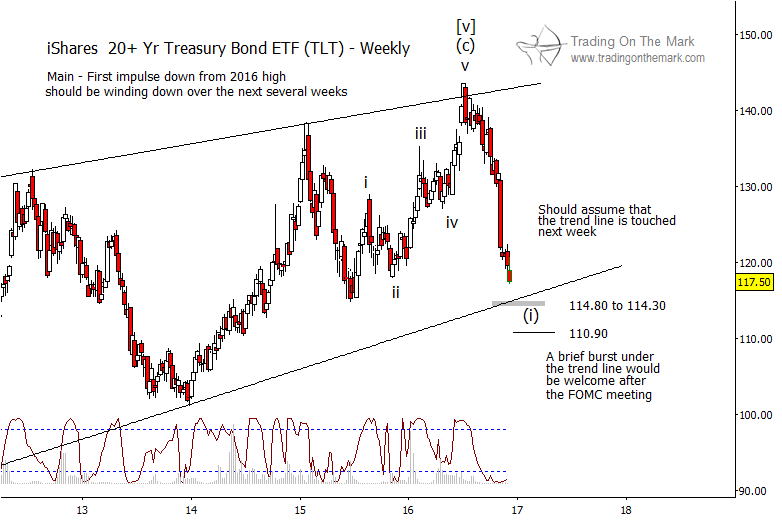
On the weekly chart below, Fibonacci relationships among the components of the decline identify possible support that is near the area of the trend line we drew on the monthly chart above. Thus we would expect signs of slowing momentum as price approaches 114.80 to 114.30. In the event that TLT produces a more extreme spike move in reaction to the results of the FOMC meeting to be reported on Wednesday, then 110.90 could act as a platform for the next bounce.
It is almost certainly too late to get on board the present bearish move for anything other than intraday trades. However, a bounce into early 2017 might provide additional opportunities for short positions. We will be able to identify resistance areas and potential entry points after TLT has made a near-term low.
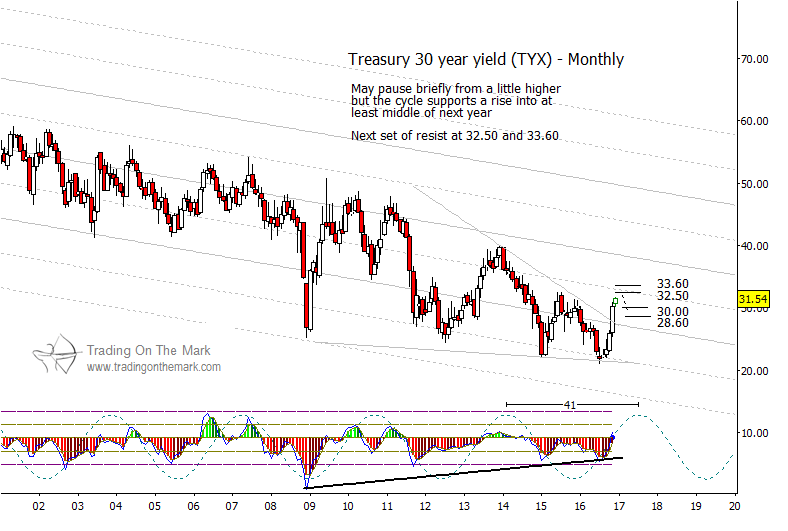
On the Treasury 30-year yield chart, we see that the index is approaching resistance near 32.50 and possibly 33.60. The higher of those Fibonacci levels may also coincide with resistance provided by a harmonic of the downward channel. A brief pause or small decline could bring the index back to the 30.00-28.60 area, but we expect yields to maintain a larger upward trend into 2017.
There’s more! As you make your trading plans for 2017, let us help you see the opportunities and risks. This month, we’re offering a 20% discount on our daily analysis service, which includes regular updates for the S&P 500, crude oil, the Dollar and other currencies, precious metals, bonds, and more. Just follow this link and use the coupon code 4CCF7 to claim your discount.
Thanks for reading.
Also read: Is The Euro About To Fall Through The Floor?
Twitter: @TradingOnMark
No position in any of the mentioned securities at the time of publication. Any opinions expressed herein are solely those of the author, and do not in any way represent the views or opinions of any other person or entity.


: Showing Some Signs of Emerging Strength")
