In our June post about treasury bond futures and the related iShares Barclays 20+ Year Treasury Bonds ETF (NASDAQ:TLT), we suggested that both were showing signs of topping out.
In the months since then, treasury bonds and the TLT have made downward moves that we are watching as the possible start of a change in trend.
In this post, we show the price areas to watch on the popular treasury bonds ETF (TLT) for confirmation that the market has turned bearish for long-term bonds.
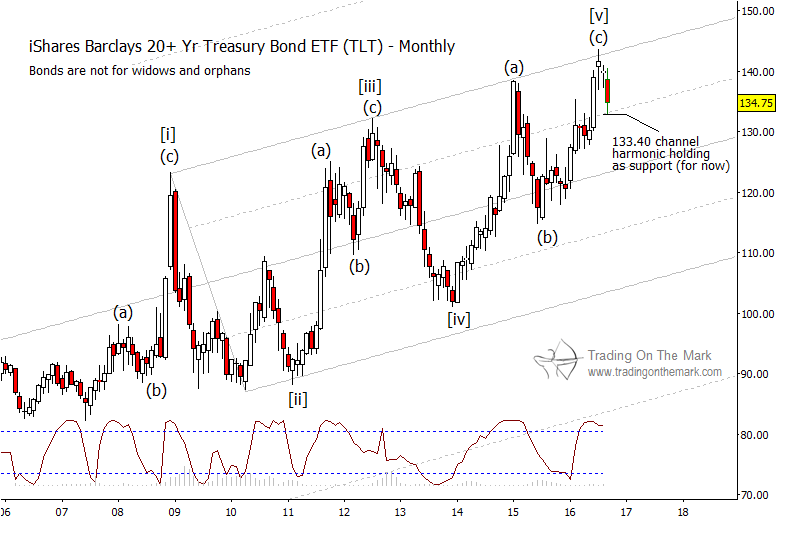
For perspective, the monthly chart shows how TLT has traced a possible ending diagonal pattern since 2008. It also recognizes the boundaries of a channel. In recent months, price retreated from a test of the upper channel boundary and found support near the one-quarter channel harmonic. Meanwhile, the Lomb periodogram (a cyclic indicator) appears ready to turn downward.
Even without considering the Elliott wave pattern of an ending diagonal, a monthly close beneath the supporting channel harmonic near 133.40 probably would be interpreted by the market as bearish going into 2017 and perhaps beyond.
It is easier to see weakness developing on a faster chart. On the weekly chart below, note how price recently tested beneath the supporting trend line that had been working since late 2015. Even so, it is too early to be certain that the top is in. Going forward, we are working with two scenarios.
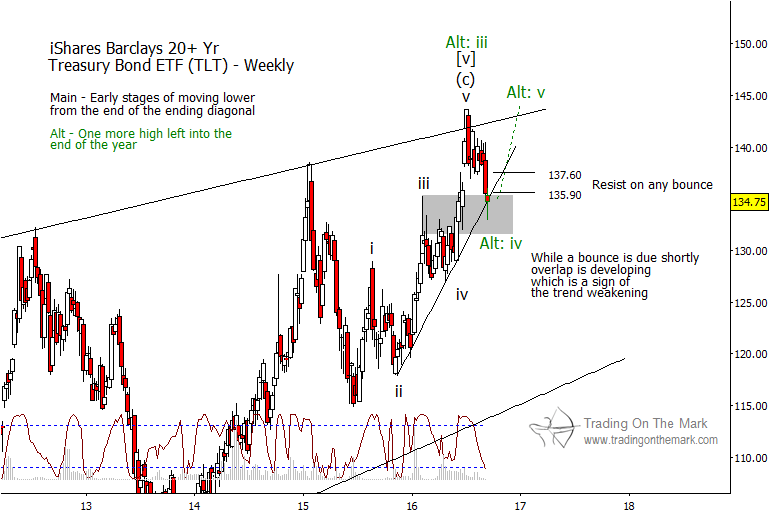
Our main scenario considers the top to be in for the treasury bonds ETF (TLT) with the July 2016 high. If that is the case, then the Summer decline represents only part of the first leg of a new downward structure. A minor upward retracement from last week’s low could test the resistance levels shown on the chart, near 135.90 and possibly 137.60. After that, we would expect the decline to continue for a few more weeks before we would need to consider the possibility of a larger upward retracement.
Our alternate scenario considers the possibility that the top is not yet in, with last week’s low representing a fourth-wave correction. In that scenario, a bounce from nearby should surpass the resistance levels shown, and we would begin charting the structure of the final upward push to a new high.
Keep in mind that last week’s decline took price almost as low as it can go while still keeping the alternate, near-term bullish scenario alive. A weekly close beneath approximately 132.50 would invalidate the alternate scenario.
If the decline in bond futures takes hold, then we would expect to see a corresponding rise in treasury yield.
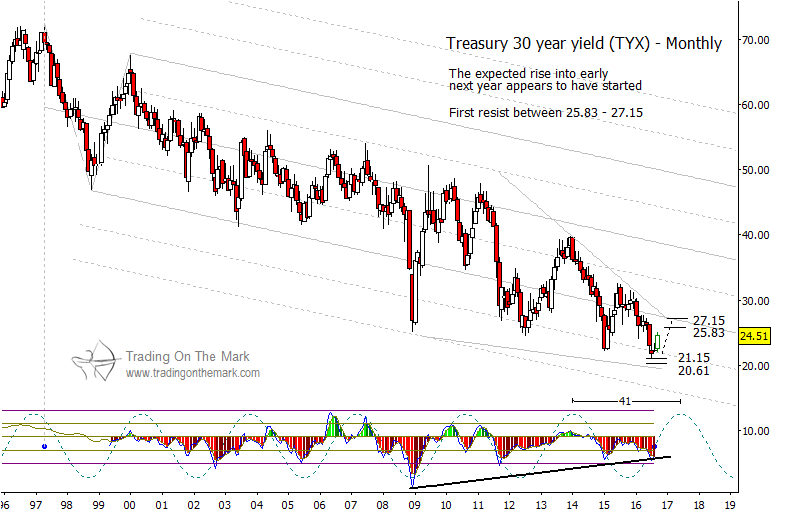
On the monthly chart for the Treasury 30-year Yield Index (INDEXCBOE:TYX), near-term support lies in the area of 21.15 to 20.61. A bounce in yields should test the lower boundary of the declining channel, with prominent resistance levels near 25.83 and 27.15.
Our next email bulletin will focus U.S. equity indices. Request your copy via this link.
Thanks for reading.
Twitter: @TradingOnMark
No position in any of the mentioned securities at the time of publication. Any opinions expressed herein are solely those of the author, and do not in any way represent the views or opinions of any other person or entity.


