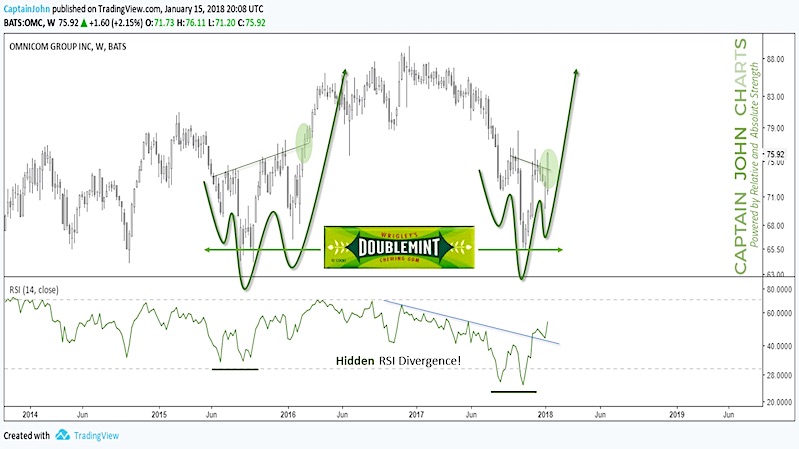
Omnicom Group (OMC) is trying to bottom here, as its stock looks to be putting in a bullish head and shoulders bottom… for the second time in 2 years!
Below is a chart highlighting this bullish trading setup. I’ve also listed 3 reasons this setup has good risk-reward.
Omnicom Group Stock (OMC) Trading Setup – Bullish Indications:
1. Possible Double bottom off of the 2015 lows, which includes a second head & shoulders pattern
2. Bullish hidden RSI divergence
3. Bullish RSI breakout with test
Omnicom Group Inc (OMC) Weekly Stock Chart
If you are interested in learning more about our investing approach and financial services, visit us at CaptainJohnCharts.
Twitter: @CptJohnCharts & @FortunaEquitis
The author may have a position in mentioned securities at the time of publication. Any opinions expressed herein are solely those of the author, and do not in any way represent the views or opinions of any other person or entity.

: Worrisome to Broader Market?")

