Technology stocks continue to lead the broader market higher. Without them, who knows where the stock market would be!!
Today’s chart highlights Tech’s leadership, along with it’s long-term rising trend.
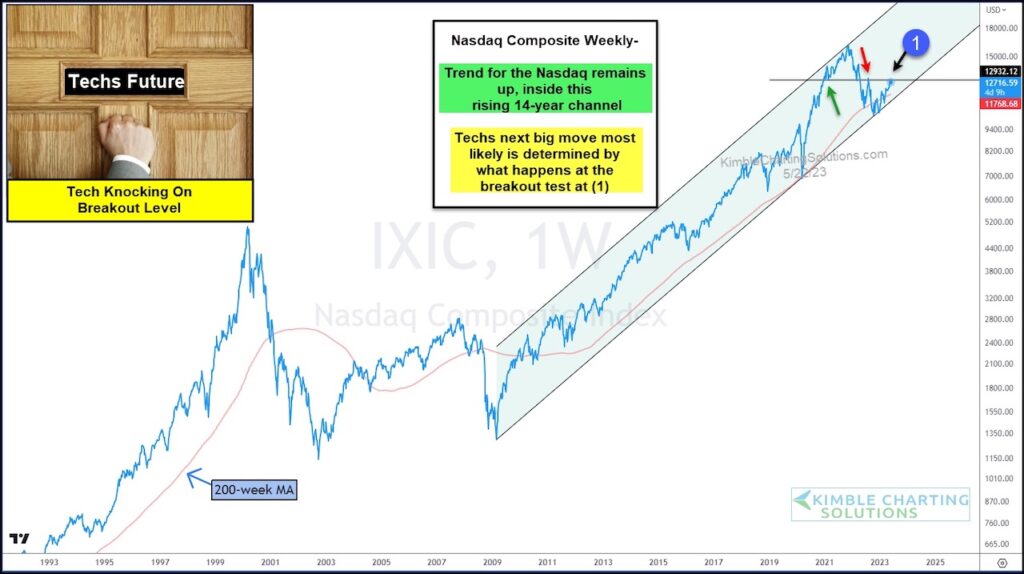
Below you will see a “weekly” chart of the Nasdaq Composite. As you can see, the Nasdaq is in a 14-year rising channel (bullish). And last fall’s low was formed at the lower end of the channel at the rising up-trend. We highlighted this support last month.
The Nasdaq has now rallied back to an important support/resistance area at (1). And what happens next could be a big deal. A Breakout would put bulls in control while a turn lower would give bears a chance. Stay tuned!
Nasdaq Composite “weekly” Chart
Note that KimbleCharting is offering a 2 week Free trial to See It Market readers. Just send me an email to services@kimblechartingsolutions.com for details to get set up.
Twitter: @KimbleCharting
Any opinions expressed herein are solely those of the author, and do not in any way represent the views or opinions of any other person or entity.


 – Warren Buffett’s Biggest Holding!")


