As we have pointed out several times, tech stocks have lead the the bull market since the financial crisis.
And today’s chart highlights that, as well as important 14-year bull market support.
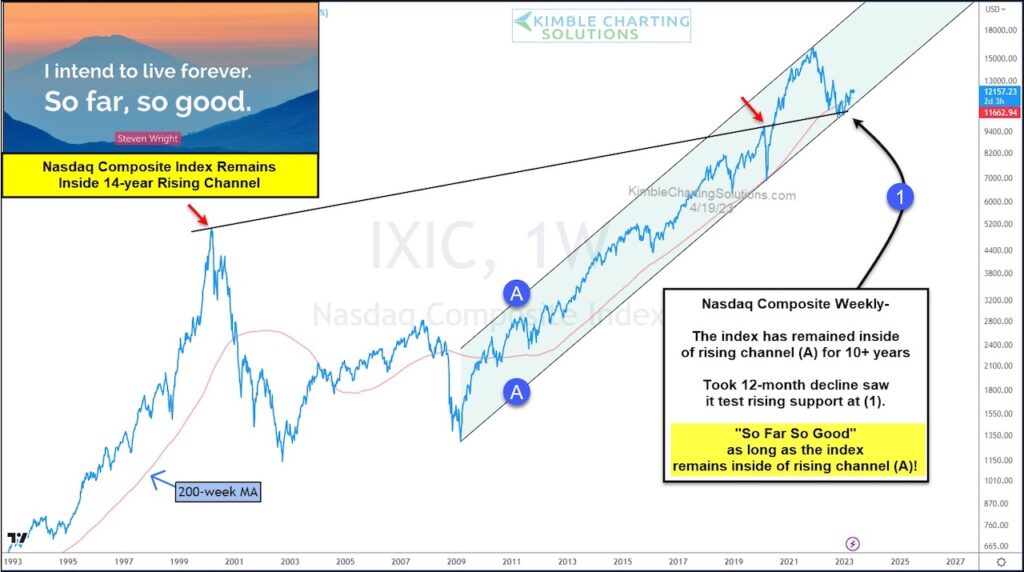
Below is a “weekly” chart of the Nasdaq Composite. As you can see, the Nasdaq has remained inside a rising bull market channel for the past 14 years, marked by each (A). But within the past 18 months, it hit the top of the channel (resistance) and turned lower.
That turn lower, saw the Nasdaq test dual trend support at (1), fortified by its 14-year up-trend support line.
So far, so good for tech bulls. The Nasdaq has held support and is attempting to rally. This will be an important support level to watch for investors in the months to come. Stay tuned!
Nasdaq Composite “weekly” Chart
Note that KimbleCharting is offering a 2 week Free trial to See It Market readers. Just send me an email to services@kimblechartingsolutions.com for details to get set up.
Twitter: @KimbleCharting
Any opinions expressed herein are solely those of the author, and do not in any way represent the views or opinions of any other person or entity.

: Cup (and Maybe Handle) Watch")
 Trading Near Top Of Price Range")

