The other U.S. demand increase mystery was the USDA’s 2016/17 corn-ethanol use forecast of 5,300 million bushels for 2016/17 versus 5,250 million in 2015/16.
Granted it’s only a 50 million bushel increase year-on-year, however any increase, seems illogical for the following reasons:
- The USDA is essentially saying they believe 2016/17 U.S. weekly gasoline demand (Sep 1st, 2016 through August 31st, 2017) will average something higher than the current average for 2015/16, which is 9.175 million barrels per day as of the week ending 5/6/16. This current average happens to be the highest weekly average since 2007/08’s 9.263 MMBpd. Given that the recent surge in U.S. gasoline demand has been precipitated by historically cheap retail gasoline prices along with crude oil trading down to its lowest level since 2003, I’m of the opinion it’s a bit of a stretch to assume this pattern of “cheap gas” will continue for another 14 months. In fact, crude oil has already bounced nearly $21 off its current 2016 day low of $26.05 per barrel. Furthermore as we’ve recently seen in soybeans, negative fundamentals don’t always guarantee lower and lower prices. At some point every commodity has value below a certain level with “money” investors continuing to search out commodities they believe are under-valued. Bottom-line I’m not expecting gasoline demand to be higher than the current average for 2015/16.
- A U.S. corn-ethanol demand forecast of 5,300 million bushels equates to approximately 14.95 to 15.105 billion gallons of crop year U.S. ethanol production. Therefore if E10 Demand is going to account for approximately 14.07 billion gallons of that production estimate (E10 Demand = 915,000 bpd of ethanol; which is 10% * 9.15 MMBpd of AVG U.S. Gasoline Demand for 2016/17), the rest essentially has to come from U.S. ethanol exports. This then would require 0.880 to 1.035 billion gallons of exports. Can it be done? Yes, but those are very optimistic projections.
- In the USDA’s February Ag Baseline Projections they estimated U.S. corn-ethanol demand at an average of 5,125 million bushels from 2016/17 through 2025/26 with a high-to-low range of just 5,225 million to 5,000 million. Furthermore the USDA had that figure trending lower over time. Why? E10 still represents the major bottleneck to major increases in U.S. corn-ethanol demand above 5,200 to 5,250 million bushels. The export market will be required to push that figure sharply higher. 5,250 million bushels is likely the high water mark for U.S. corn ethanol demand.
Overall, just how accurate is the USDA’s initial May 2016/17 U.S. corn S&D balance sheet? Consider the following and see tables below for entire crop year detail:
- YIELD – Since 2004/05 the biggest variance in the U.S. Corn Yield from the USDA’s initial estimate in May versus Final has been -42.9 bpa. In 2012/13 the USDA estimated the U.S. corn yield at 166 bpa in May versus the Final yield of 123.1 bpa (-42.9 bpa). Overall however, the average yield increase over that timeframe (occurring in 7 of 12 crop years) has been +4.6 bpa with the average yield decrease (not including 2012/13) totaling -5.9 bpa.
- ENDING STOCKS – Since 2004/05 the biggest positive variance in the U.S. Corn Carryout from the USDA’s initial estimate in May versus Final has been +1,373 million bushels with the average increase totaling +487 million bushels (occurring in 8 out of 12 crop years). The biggest negative variance has been -1,060 million bushels with the average decrease totaling -774 million bushels.
I think the reality is the USDA’s May WASDE report and S&D projections represent a very generic starting point and should viewed as nothing more than that. A lot can and will change as the market transitions past spring planting, and starts to assess more realistic yield and planted acreage estimates. For now, I expect CZ6 to remain range bound from approximately $3.80 to $4.05.
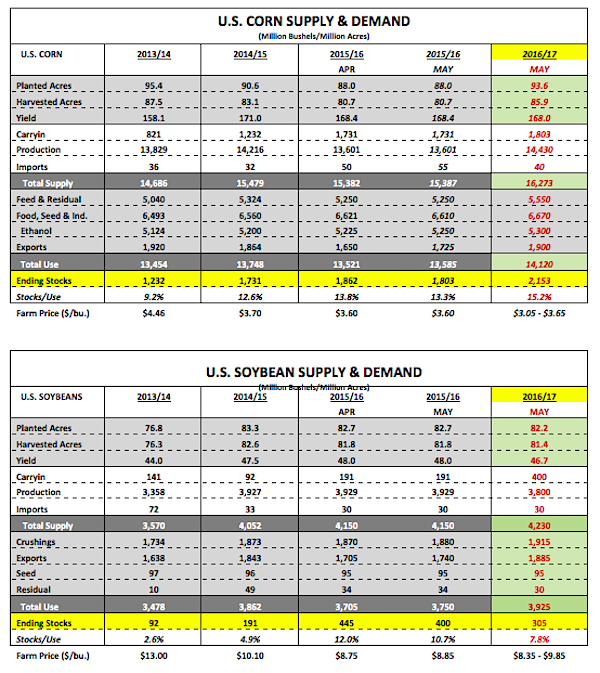
May 2016/17 U.S. Corn & Soybean Balance Sheets
Key U.S. Corn Supply & Demand Trends May vs Final

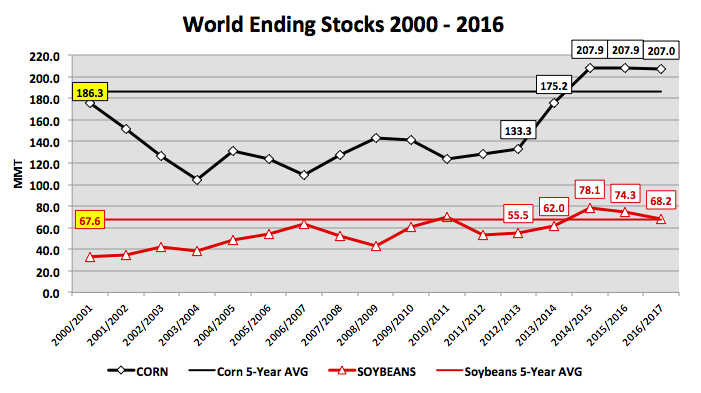
World Stocks
Thanks for reading.
Twitter: @MarcusLudtke
Author hedges corn futures and may have a position at the time of publication. Any opinions expressed herein are solely those of the author, and do not in any way represent the views or opinions of any other person or entity.
Data References:
- USDA United States Department of Ag
- EIA Energy Information Association
- NASS National Agricultural Statistics Service

 Testing Important Price Support")
: Cup (and Maybe Handle) Watch")

