Walking Through The USDA’s May WASDE Report
SOYBEANS ANALYSIS
The USDA’s May WASDE report (released May 10) was exactly what Soybean Bulls were hoping for and then some with November soybean futures having stagnated in the $10.00 to $10.30 per bushel range prior to its release. However all that was needed was a 2016/17 U.S. soybean ending stocks forecast 100 million bushels BELOW the average trade guess, which in turn produced a 51 ¾-cents per bushel higher close Tuesday afternoon (SX6 settled at $10.67 ½, highest since 8/8/2014).
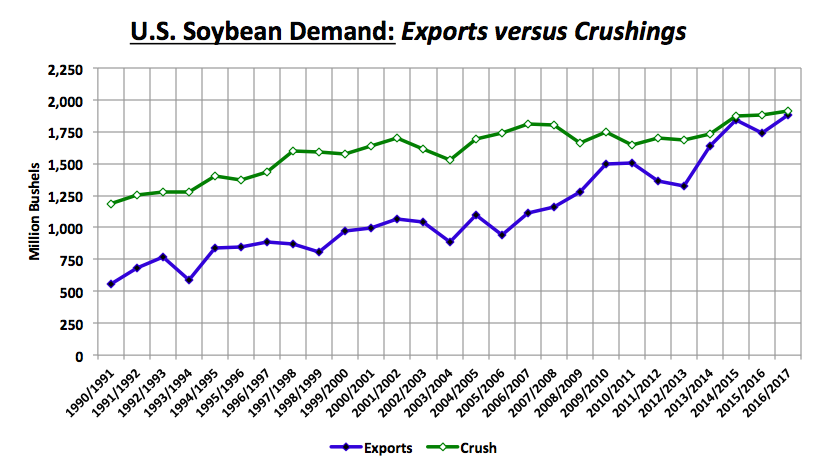
The U.S. soybean carryout was estimated at 305 million bushels, which was just 15 million bushels higher than the low end of pre-report trade guesses. Record demand projections for U.S soybean exports (1,885 million bushels) and crushings (1,915 million bushels) were the key drivers in the lower than expected initial new-crop carryout assessment.
Will the May Crop report prove to be the primary catalyst in igniting the next wave higher in soybean futures prices?
It certainly feels that way. Bears had been arguing for weeks (myself included) that the soybean rally had very little to do with supportive market fundamentals. This view was seemingly validated by Money Managers buying more than 280,000 contracts since March 1st despite 2015/16 World soybean ending stocks forecasted at a record high of 79.02 MMT at that time. HOWEVER the USDA’s May WASDE report has since completely changed the forward fundamental landscape. The USDA revised its 2015/16 World soybean carryout down to 74.25 MMT while additionally issuing a 2016/17 forecast of 68.21 MMT (just slightly higher than the 5-year average of 67.6 MMT). That combination of a sizable drop in both World and U.S. soybean ending stocks is now likely more than enough to justify a more positive and sustainable price outlook on November soybean futures above $10.00 per bushel until more is known about Argentina’s flood-reduced soybean crop, as well as, 2016/17 U.S. soybean production prospects.
I do believe the USDA’s June 30th Acreage report will show 2016 U.S. soybean planted acreage up 1 to 2 million acres versus its March Intentions estimate of 82.236 million acres. However the reality is even a 0.8 bpa yield reduction from the USDA’s May forecast of 46.7 bpa would largely negate any production increase via a higher planted acreage base. For example, 46.7 bpa on 81.4 million harvested acres equals total soybean production of 3,800 (the USDA’s current forecast), which is the same as 45.9 bpa on 82.9 million harvested acres. Additionally with the market choosing to focus on the potential for a late growing season La Nina, it’s going to be hard for Soybean Bears to diffuse perceived fears (either real or imagined) concerning future yield reductions, and therefore by default, tighter stocks projections.
Technically I still believe November soybeans will correct lower at some point in the near future with the RSI suggesting soybeans are overbought, as well as, the soybean (SX6)/corn (CZ6) price ratio expanding to levels that would suggest making a short-term “buy corn, sell soybeans” market play. That ratio closed at 2.77 on 5/11. Comparatively speaking, the widest that ratio traded out to from Jan 1st – Jun 30th, 2015 was 2.57 on 6/22. Therefore CZ6 is likely to gain on SX6 over the next couple weeks. That said based on how far November soybeans have now rallied since making a day low of $8.68 on March 2nd, SX6 could theoretically break 50 to 60-cents and still technically be in an uptrend.
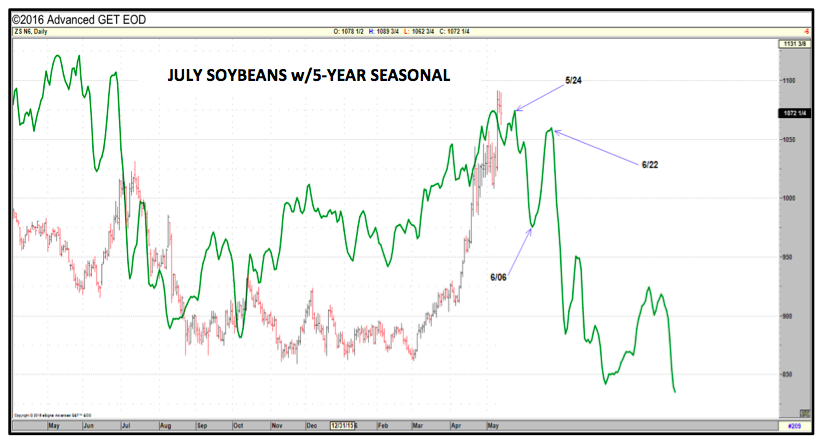
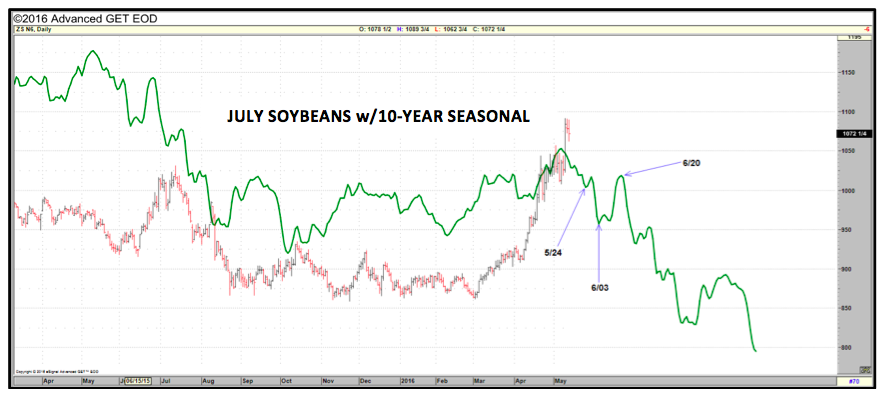
The 5 and 10-year July futures price seasonality both show soybean futures trending lower into the first week of June. Key resistance and support levels for SN6 are as follows: Resistance = 11.09 ¼ to $11.10 ½, which coincides with a notable day high on 9/12/14, as well as, the 38.2% Fibonacci retracement of the major high-to-low move from 5/22/14 through 3/2/16 on the Continuous chart. Support = $10.00 to $10.08, which were the day lows established prior to the release of the May WASDE report. Overall, both the revised market fundamentals and Managed Money in-flows now favor Soybean Bulls longer-term, while supporting an eventual move above $11.00 in the front-end. I am expecting any nearby, seasonal price weakness (20 to 30-cent breaks) to be viewed as a buying opportunity.
CORN ANALYSIS
The 2016/17 U.S. corn balance sheet on the contrary was unequivocally Bearish even with the USDA doing its best to “manufacture” extremely optimistic usage projections via the May WASDE report. Ending stocks were estimated at a very robust 2,153 million bushels. On the supply side, the USDA’s acreage and yield projections were essentially as expected at 93.6 million planted acres and 168.0 bushel per acre for total record corn production of 14,430 million bushels. However on the demand side, the USDA chose to raise Feed & Residual demand an aggressive 300 million bushels year-on-year to 5,550 million, which if realized would be the highest figure since 2007/08’s 5,858 million bushels.
By comparison, Feed & Residual use has averaged 4,932 million bushels over the past 8-years (2008/09 – 2015/16). Why has Feed and Residual use trended lower over this timeframe? One reason, that period coincides with U.S. corn-ethanol demand growing from approximately 3,677 million bushels in 2008/09 to 5,250 million bushels in 2015/16. That 1,573 million bushel increase produced an additional 435 million bushels of DDGS (approximately), which in turn displaced a certain percentage of feed corn demand. Therefore I’m hard pressed to find anyone who can justify the USDA’s 300 million bushel increase to Feed & Residual demand for 2016/17, outside of it possibly being regarding as an increase to “residual” use, which in effect is the USDA’s method of hedging against its record U.S. corn production estimate.
continue reading on the next page…

 Testing Important Price Support")
: Cup (and Maybe Handle) Watch")

