For the third time in as many years, gold is brushing up against the US$2,000 per ounce zone, which of course raises the question whether this resistance level will hold once again or will the yellow metal finally break out.
For any investor who has invested in gold or gold miners for more than a few months, it can be one of the more frustrating and sometimes mystifying holdings. The rally in 2020 was pretty logical, given the uncertainty of Covid and the amount of central bank balance sheet expansion. But the languishing price in 2021 and drop in the first half of 2022 was at odds with rising inflation.
More recently, bank stress has seen gold rise again to 2,000 before giving a little back in recent weeks.
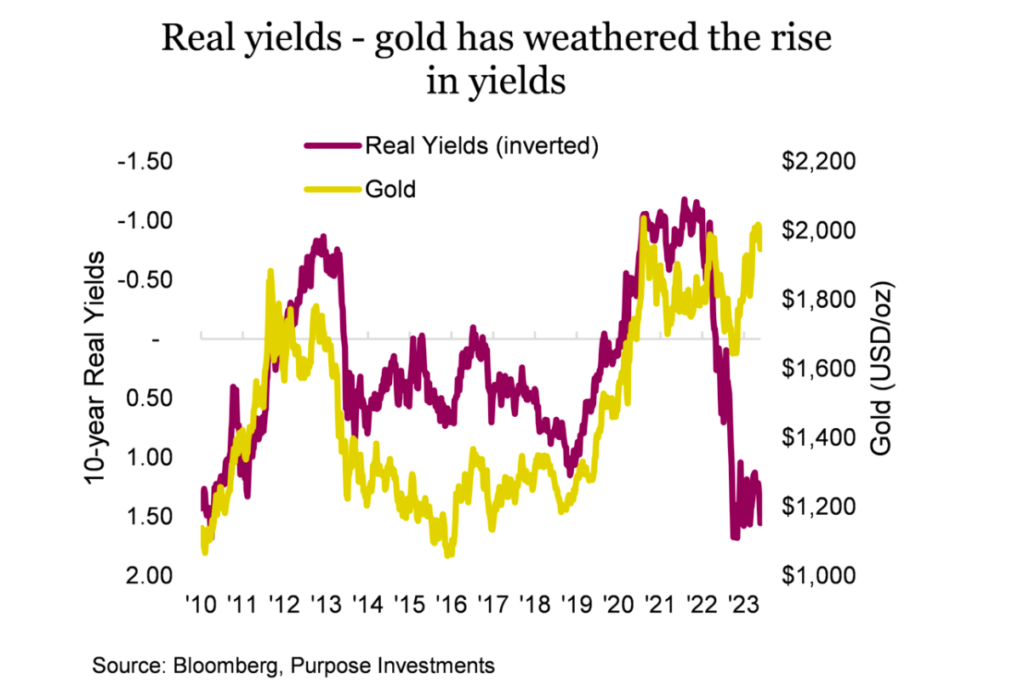
Even today, many historical drivers of gold prices are at odds. The rise in nominal and real bond yields certainly augers for a lower price of bullion, as does limited equity market volatility. Yet, the persistent higher inflation is supportive of a higher price, as is the U.S dollar. Nobody said investing would be easy.
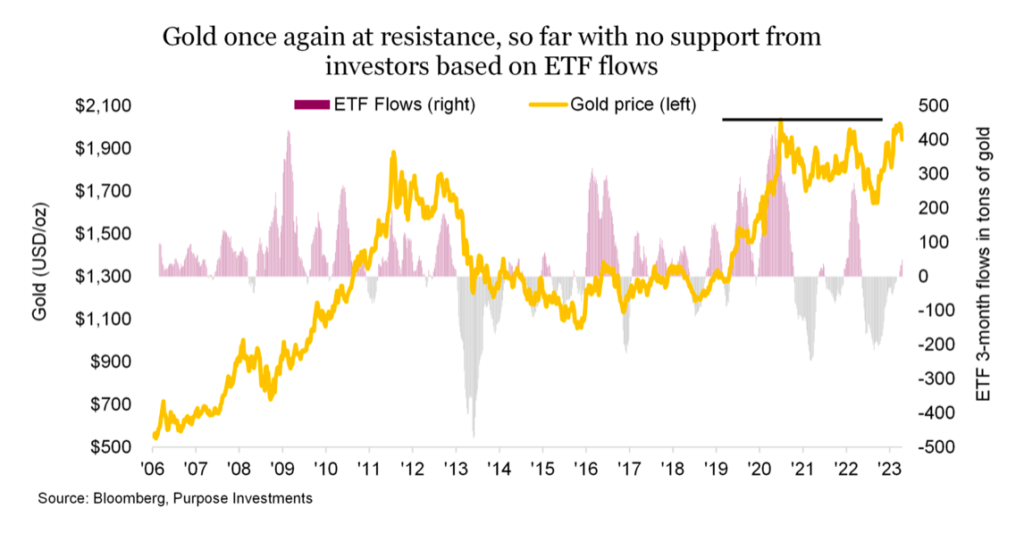
Perhaps one of the biggest swing factors that tends to drive gold price is ETF flows, aka retail. As you can see in the chart, gold often moves in tandem with gold ETF flows, both up and down over the years. Yet gold’s recent advance has been during a period of ETF outflows. Counter to the ETF outflows has been central bank buying, which set an all-time record in 2022 and continues into 2023. Perhaps the Western imposed sanctions have encouraged many central banks to increase their reserve diversification away from Treasuries on the margin. Whatever the motivation, these actions have helped counter the ETF flows.
Gold technical take
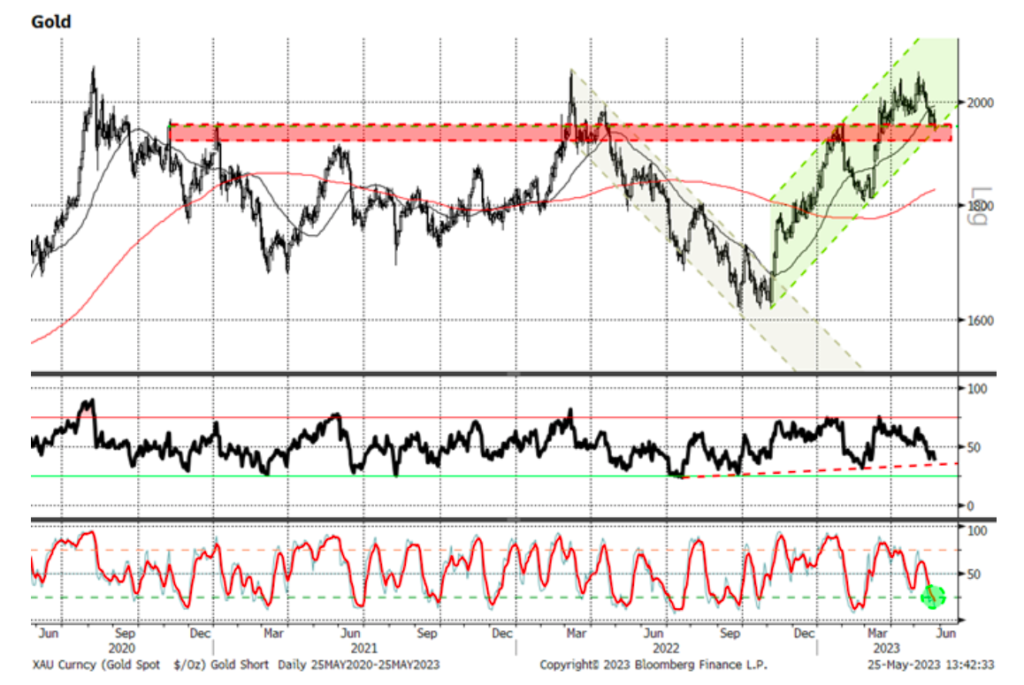
From a technical perspective, gold is at an interesting crossroad. Over the past three years, it’s gone from a new all-time high in 2020 to a prolonged consolidation period. It’s now attempted on two occasions to break through and solidly hold onto a 2000 handle. The first attempt early last year, saw it later retrench to nearly $1600/oz, largely due to a strong dollar and central banks hiking rates at an accelerated pace.
Following the breakout from that downtrend last November, gold has rallied alongside risk assets to attempt a second thrust to new highs. Aided by a mini bank crisis, gold held above $2000/oz for a number of days but has pulled back rather suddenly thanks in part to dollar strength, and rising rates. The pullback has brought it back to the lower bounds of the current trend channel.
With the price sitting on a key support level, as well as staying within the current trend channel, we see a favourable setup for a potential upside rotation back towards recent highs. For now, gold remains in a mid-long term upside trend with an upward bias.
As the bulls and bears battle it out around key support, it appears the gold market is mired with indecision. The Relative Strength Index (RSI) oscillator has pulled back below 50 but is showing a mild bullish divergence which is a good sign for the further rally. In addition, there is an impending bull cross on the moving average convergence/divergence (MACD) indicator. This indicates an oversold market with tiring sellers. Upside moves could find some resistance around the psychologically important 2000 level as well as the 50-day moving average at $1993. For those underweight, this is looking like a good time to begin to a build position from a risk/reward perspective.
What’s next?
Investing isn’t about trying to explain the past, it’s about the future. Do you think central banks will continue buying? We do. What about yields, both nominal and real? Well, gold has weathered yields moving higher in good fashion. They could still move higher but most of this move is probably done. And as the Fed likely stops raising rates soon, that should turn a headwind into no-wind. Inflation may continue to come down this year, as is our expectation, but will likely remain higher than past years. This should continue to be a positive for gold.
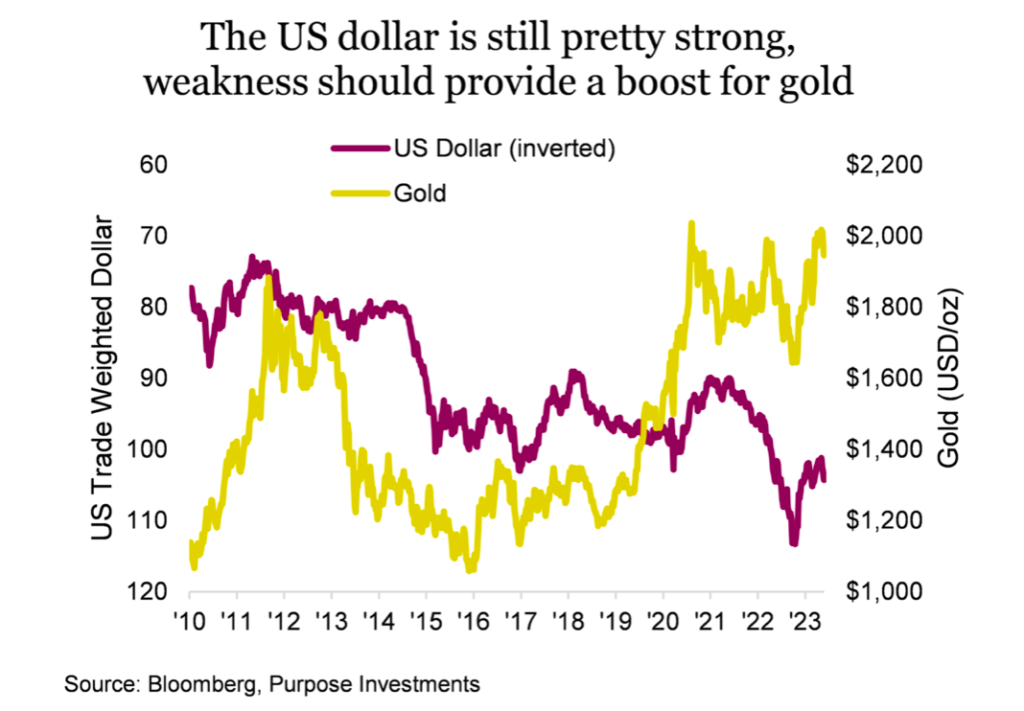
Then there is the dollar. We are not in the de-dollarization camp and the U.S. dollar could see an uptick if a recession develops. Near term that may be a headwind but if the dollar is moving higher on recession, market volatility may provide an offsetting tailwind. Sorry, too much talk of wind … we’re starting to sound like some sort of swirling vortex. Nonetheless, over the longer term we are anticipating to be dollar bears, which is gold positive.
Final thoughts
Gold remains a stone throw from a key resistance level despite cooling inflation and higher yields. If a recession is on the horizon, we believe yields could tick lower and market volatility rise. Both are potential positives that could help gold finally break through this ceiling. And if retail start buying, and there have been some signs of late, this third visit to resistance may be the breakthrough gold investors have been long waiting for.
Source: Charts are sourced to Bloomberg L.P., Purpose Investments Inc., and Richardson Wealth unless otherwise noted.
Twitter: @ConnectedWealth
Any opinions expressed herein are solely those of the authors, and do not in any way represent the views or opinions of any other person or entity.

 Testing Important Price Support")
: Cup (and Maybe Handle) Watch")

