It’s been a good year for Gold, Silver, and precious metals bulls.
Gold is up +12.3%, while Silver is up +7.6%.
But the 4th quarter will be an important one. And should confirm whether or not Gold (GLD) and Silver (SLV) are in a new bull market (substantial higher lows). Both peaked in early September and have sold off from there.
In today’s chart update, I look at Gold, Silver, the Gold Miners (GDX), and the Silver Miners (SIL). All four of these price charts are showing strong intermediate-term posture but will need to hold key support areas on this correction. As well, Silver is lagging Gold this year and will need to see some momentum from Silver to add beta to the asset class.
Note that the following MarketSmith charts are built with Investors Business Daily’s product suite.
I am an Investors Business Daily (IBD) partner and promote the use of their products. The entire platform offers a good mix of technical and fundamental data and education.
All of the supports mentioned below bear importance to the near-term or intermediate-term for Gold and Silver (precious metals). For instance, losing a key near-term trend line likely means additional time for the correction (and time to re-construct a new base after reaching a low).
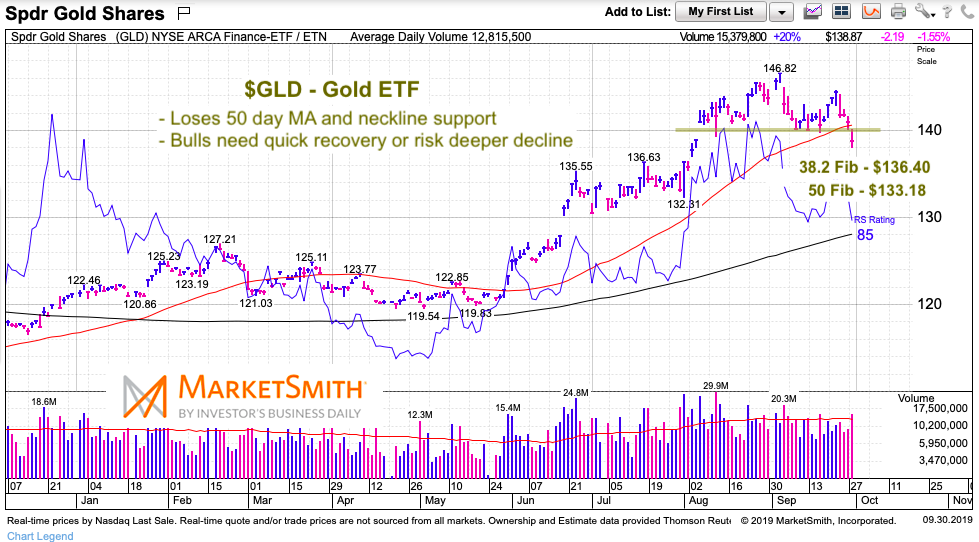
$GLD Gold ETF Chart
Gold formed a topping pattern over the past 6 weeks that may be on the verge of breaking down if bulls don’t recover $140 quickly.
Should gold continue lower, then eyes turn to the 38.2 Fibonacci ($136.40) and 50 Fibonacci ($133.18). The rising 200 day MA is further below.
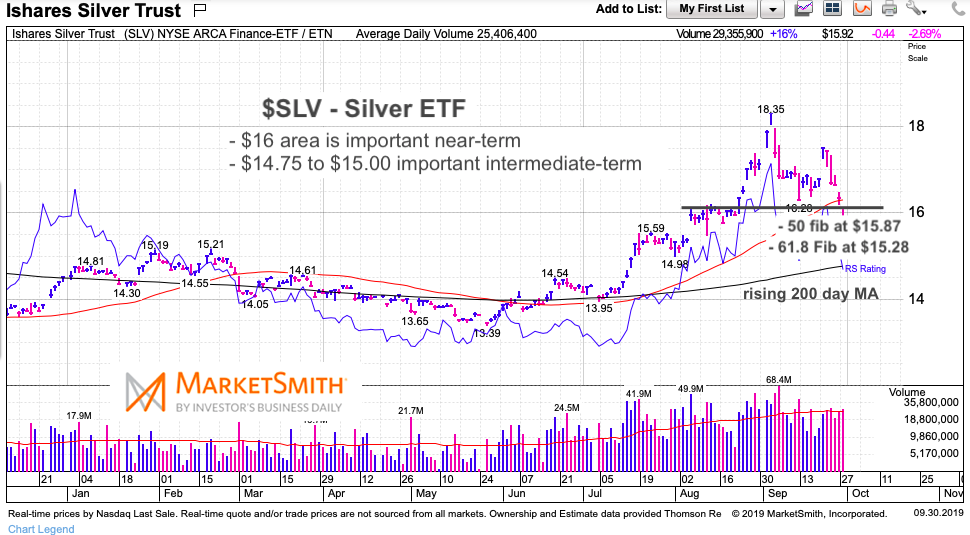
$SLV Silver ETF Chart
Similar support being testing for the Silver ETF. If support breaks, then we have a deeper pullback that should test key Fibonacci levels, and perhaps the 200 day MA.
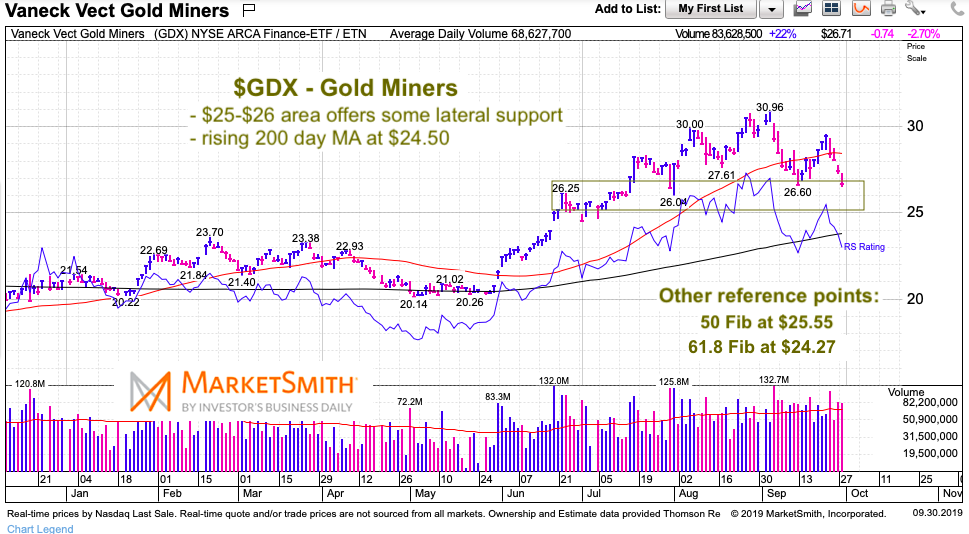
$GDX Gold Miners ETF Chart
The gold miners have support in the $25-$26 price area. After that is the rising 200 day moving average (around $24.50) and the 61.8 Fibonacci level around $24.27.
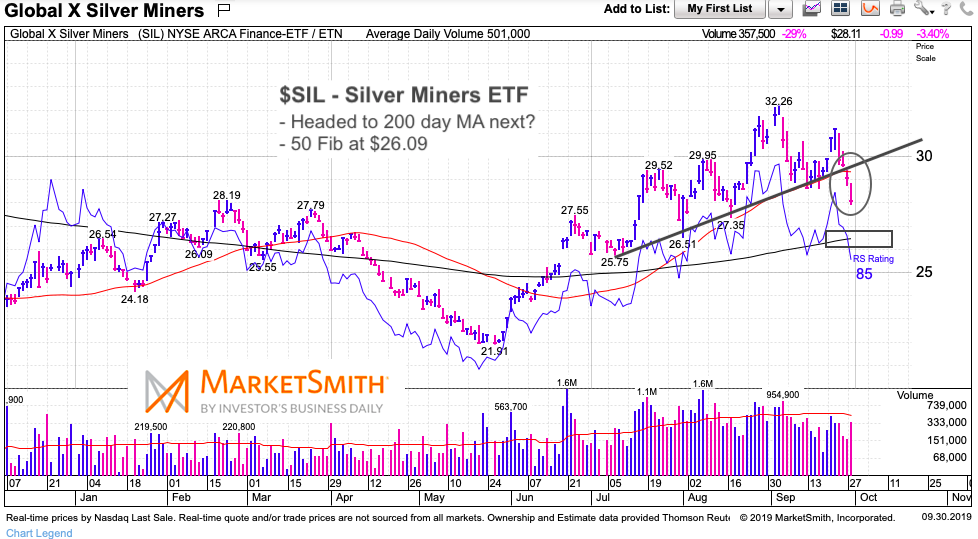
$SIL Silver Miners ETF Chart
The silver miners have breached trend support and may have a date with the rising 200 day moving average.
Twitter: @andrewnyquist
The author may have a position in mentioned securities at the time of publication. Any opinions expressed herein are solely those of the author, and do not in any way represent the views or opinions of any other person or entity.
 Posts Strong Break Out!")

