The stock market is still in counter-trend rally mode. At least we have to respect the technical structure of the decline until we see further evidence of constructive price action.
Today we look at the rally from a broader lens and highlight potential price targets using fibonacci retracements. I have found them to be very useful and often magnets that align with other indicators such as moving averages.
Note that the following MarketSmith charts are built with Investors Business Daily’s product suite.
I am an Investors Business Daily (IBD) partner and promote the use of their products. The entire platform offers a good mix of analysts, education, and technical and fundamental data.
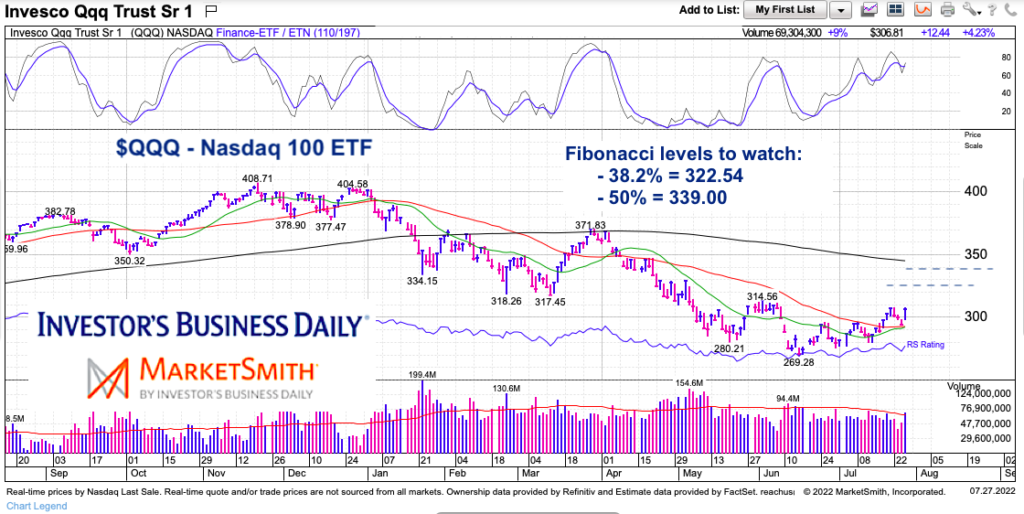
$QQQ Nasdaq 100 ETF Chart
It’s as simple as this. Using the overall peak at 408.71 and trough at 269.28, we can calculate Fibonacci retracements. The first area of interest is the 38.2% retracement. That comes in at 322.54 and will likely provide some resistance. A move above that level may target the 50% retracement at 339. Note that the falling 200 day moving average could potentially align with that level.
Lastly, the rounded “cup” like action is constructive for a rally. That said, longer-term bulls need to see price overtake the 200-day moving average before any thoughts of trend change… and that’s a ways off. For now, we are trading what’s in front of us.
Twitter: @andrewnyquist
The author may have a position in mentioned securities at the time of publication. Any opinions expressed herein are solely those of the author, and do not in any way represent the views or opinions of any other person or entity.


