If you are purchasing long-dated treasury bonds such as the ticker $TLT, then you are betting on long-dated t-bill interest rates to fall.
While rates have moderated, the ETF (TLT) has yet to give active investors a buy signal.
And even if it does, it will likely be a near-term signal for traders to catch a move. In any event, let’s look at a longer-term chart of TLT and provide a quick update.
Note that the following MarketSmith charts are built with Investors Business Daily’s product suite.
I am an Investors Business Daily (IBD) partner and promote the use of their products. The entire platform offers a good mix of tools, education, and technical and fundamental data.
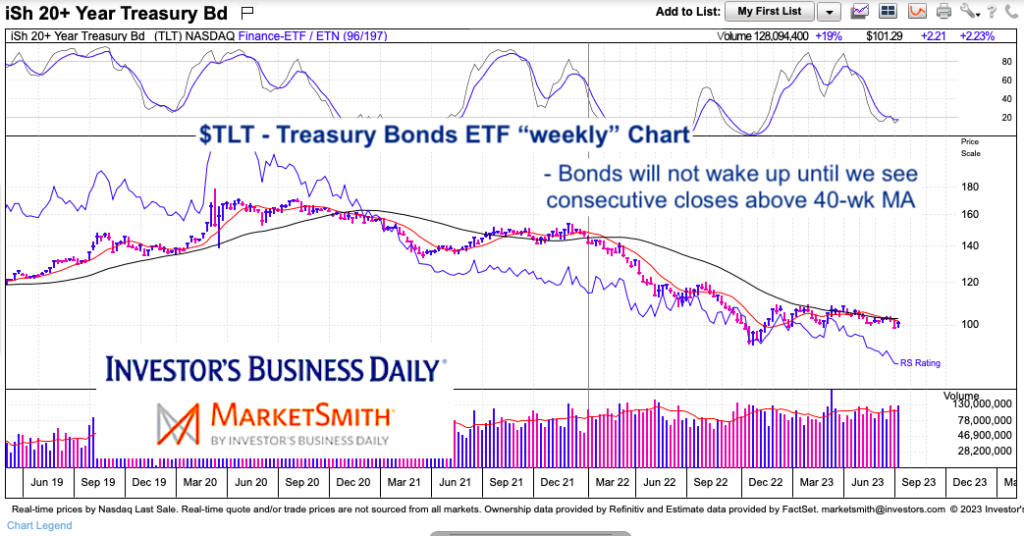
$TLT 20+ Year Treasury Bond ETF Chart
It’s clearly been a rough few years for long-dated bonds. The fall has been steep and a change in long-term trend has taken place.
But we should see some tradable rallies. In particular, it would be nice to see TLT have two weekly closings over the 40-week moving average. Until then, it’s hard to look at.
Twitter: @andrewnyquist
The author may have a position in mentioned securities at the time of publication. Any opinions expressed herein are solely those of the author, and do not in any way represent the views or opinions of any other person or entity.

 Rally Price Targets")


