Exactly a year ago, we wrote that grains were approaching support that should turn into a durable low as grain prices bottom.
Since that time, price has not moved very much. We still believe a low is nearby, and this post explores some ways to trade it with the expectation of a bounce.
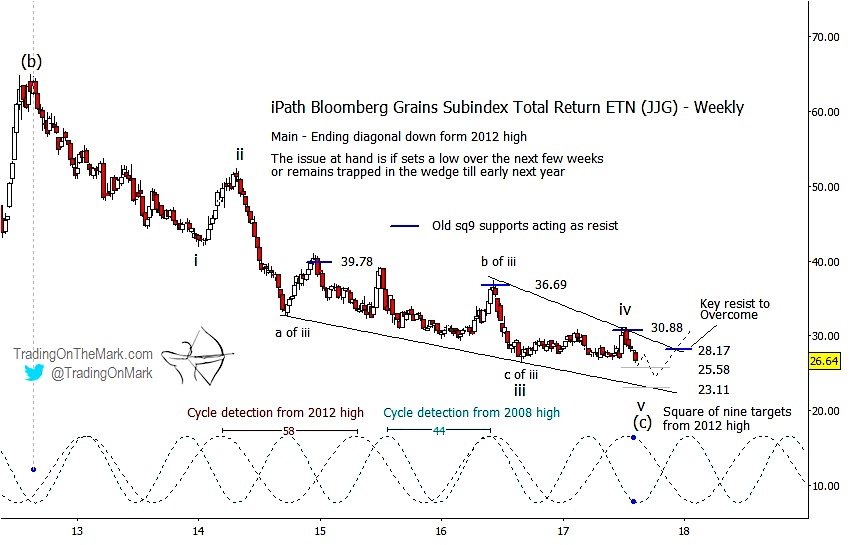
The low-volatility formation in the iPath Bloomberg Grains Subindex Total Return ETN (NYSEARCA:JJG) has persisted longer than we expected, and the precise Elliott wave count of that pattern is a bit of a judgment call. Even so, there is a lot of information to be found on a weekly chart suggesting where to watch for the trades.
First, the narrowing range shows indecision in the market, implying that an eventual breakout should be fairly strong as one side advances while the other side covers. In this case, the wedge comes at what appears to be the conclusion of a segment of the larger (a)-(b)-(c) pattern, which favors an upward reversal rather than continuation downward.
Broadly, the two main bullish trading approaches are either to watch for signs of support near what we expect to be the actual price low for grains or to look for a pullback entry after price has broken upward out of the wedge.
Specific areas we are watching for a JJG low come from Gann square-of-nine calculations that put support near 25.58 and 23.11. Note how other square-of-nine levels originating from the same 2012 high have coincided with reversals near 39.78, 36.69, and 30.88 on the chart.
If we are trying to find an entry near the low, then the two most prominent price cycles might tell us when to watch for JJG to reach that low. Based on price action since 2008, the 44-week cycle drawn in blue has done a good job of marking price inflections, even though not all of those inflections broke in the same direction as the cycle. That cycle is approaching an inflection now, which also happens to point upward (and confirm out theory that grain prices are bottoming). We also note that price is currently near the first viable Gann support level.
Another cycle based on price action since 2012 has 58-week period, which we have drawn in red. It has coincided fairly well with JJG inflections and direction. (The better fit is partly due to a more recent start date for cycle calculations.) The 58-week cycle predicts a low near the start of 2018, which also would coincide with an inflection in the older 44-week cycle.
Thus, the most favorable times for JJG to find durable support are this month and around the turn of the year.
If we use a more conservative breakout approach to find the trade, then we would want to see price move out of the formation and through the nearby Gann resistance at 28.17. At that point, we would watch for a pullback from the initial thrust to test the broken resistance or perhaps reach a standard Fibonacci retracement. Keep in mind that any breakout from a wedge is likely to provoke a strong move, and the opportunity to catch a pullback might be brief.
Our next newsletter will focus on other grain setups in addition to expanded coverage of areas to watch in currencies. Be sure to reserve your copy and follow us on Twitter for more updates!
The author does not have a position in any of the mentioned securities at the time of publication. Any opinions expressed herein are solely those of the author, and do not in any way represent the views or opinions of any other person or entity.
ALSO READ: U.S. Corn Market Update: Yields Back On The Radar

: Showing Some Signs of Emerging Strength")

