The reasons are mounting for a nearby low in grains, namely the price action. The guys from Trading On The Mark discuss what to look for when asking, will grain prices bottom soon?
As with most commodities, grain prices have been following a generally downward path since 2012. However, there are good technical reasons to watch for support – possibly even a major low or bottom in grain prices – near the present area. Here we examine the Elliott wave pattern and other measurements for the iPath Bloomberg Grains Subindex Total Return ETN (NYSEARCA:JJG).
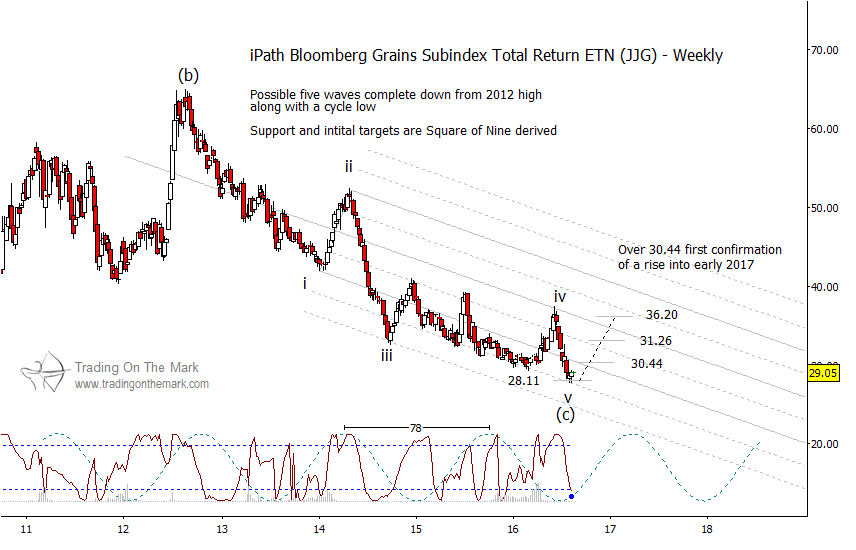
In the big picture, our count for the Grains Index (JJG) is roughly similar to the pattern we have been charting in copper during recent years. The major decline from 2008 represented wave (a) of a three-wave correction, and the rally into 2012 represented wave (b). The decline in wave (c) should consist of five sub-waves, labeled i-ii-iii-iv-v on the weekly price chart below.
Several different technical analysis methods come together to suggest that a grain prices bottom may be nearby. First, the downward wave (c) has shown excellent recognition of a channel anchored on waves ‘i’ and ‘ii’. Wave ‘iii’ tested a harmonic of the channel, and wave ‘iv’ offered an ideal case of reversal at a major element of the channel.
Apart from the channel, grain prices (via JJG) are now testing Gann square-of-nine support at 28.11. A low also is predicted by two major price cycles derived through different methods – one lasting 78 weeks, and the other having approximately half that period.
We think the weekly price chart gives a compelling case for grain prices to bounce soon, but a logarithmic chart offers even more reasons to be bullish. A log chart is often useful for understanding moves that extend very far in price or that span several years. In the case of JJG, the log of price has reached a precise 1×1 measurement down from its 2008 high.
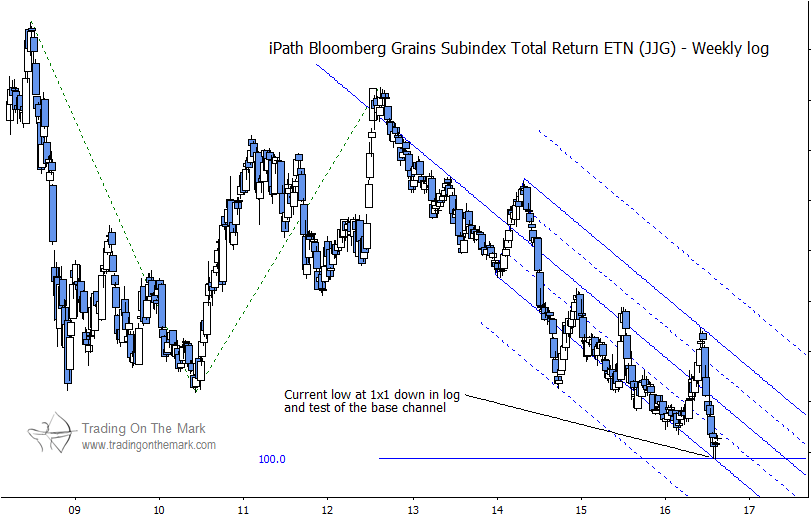
Note also how the channel on the log chart has contained the decline nicely since 2012, even though the major turns hit different elements of the channel than were hit on the regular price chart shown earlier. The log of price is just now testing the base of the channel (in addition to the big 1×1 measurement).
If price bounces from nearby, then we expect it to rally at least into 2017. Initial resistance levels to watch include 30.44, 31.26 and 36.20.
There’s more! Our August email bulletin will focus on grains. Request your copy via this link.
Twitter: @TradingOnMark
No position in any of the mentioned securities at the time of publication. Any opinions expressed herein are solely those of the author, and do not in any way represent the views or opinions of any other person or entity.


