U.S. CORN PRODUCTION REPORT SUMMARY AND MARKET REACTION
On Thursday August 10, the USDA released its August 2017 Crop Production report and it was not without its share of surprises (and criticisms).
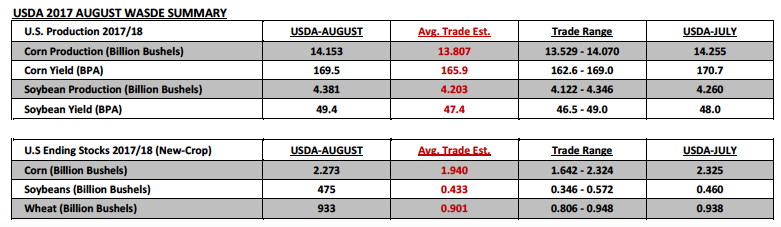
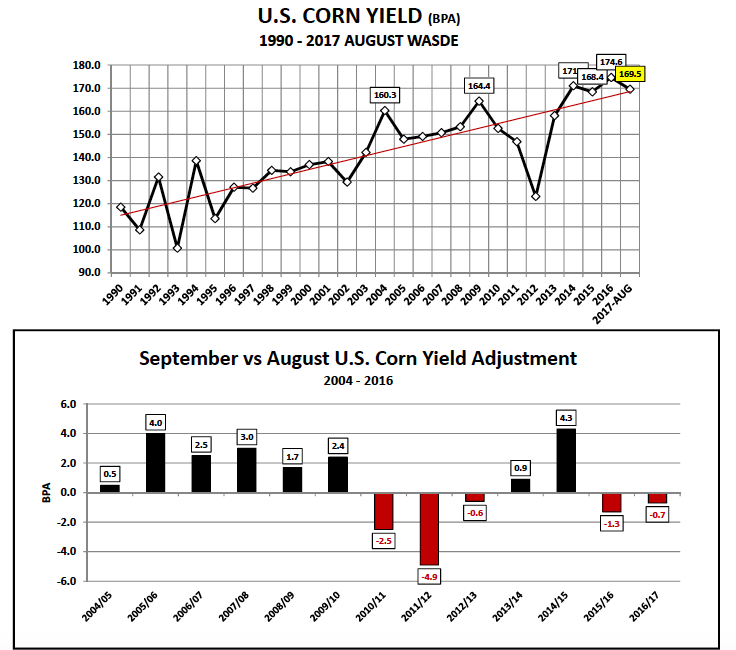
The National Agricultural Statistics Service “NASS” offered its first state-by-state yield estimates for the 2017/18 U.S. corn crop. NASS estimated the U.S. corn yield at 169.5 bpa versus 170.7 bpa in July and the average trade guess of 165.9 bpa. Total 2017/18 U.S. corn production was forecasted at 14.153 billion bushels, 346 million bushels ABOVE the average trade guess. The market reaction was both swift and unforgiving with December corn futures selling off immediately, closing down 15 ¼-cents per bushel Thursday afternoon, finishing at $3.71. This was the lowest December corn futures had closed since September 29th, 2016, signaling a significant downward momentum shift in corn prices.
I think it’s safe to say nearly everyone in the market was thrown a major curveball by NASS’s seemingly “optimistic” national corn yield estimate considering this year’s Weekly Crop Progress reports have suggested consistently that several key states across the Corn Belt have experienced less than ideal summer growing seasons.
For example on Monday, South Dakota’s corn crop was rated just 29% good-to-excellent as of the week ending August 6th, 2017, just 5% better than its drought-devastated corn crop from 2012. In 2012 South Dakota’s final state corn yield was 101 bpa. However on Thursday NASS estimated South Dakota’s 2017 state corn yield at 140 bpa (39% above 2012). Furthermore in 2013 South Dakota’s corn crop was rated 74% good-to-excellent as of the week ending August 4th, 2013, and yet that year South Dakota’s final state corn yield was 137 bpa (3 bpa LESS THAN the USDA’s current forecast). The point being there seems to be a sizable disconnect between the USDA’s current crop ratings and their implied correlation to 2017 prospective yield potential.
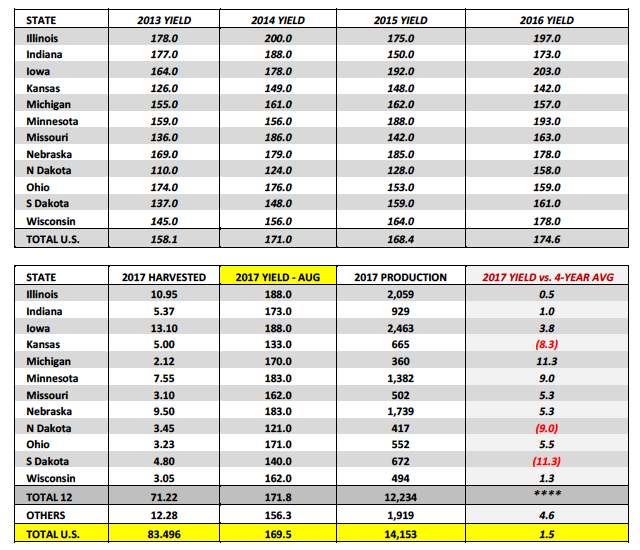
Other states with current corn yield estimates totally incongruous with their recent good-to-excellent ratings include Nebraska, Indiana, Ohio, and even Illinois. Nebraska’s corn yield was estimated at 183 bpa, only 2 bpa shy of its record corn yield from 2015 and yet Nebraska’s corn crop was rated just 59% good-to-excellent on Monday afternoon. In 2016 Nebraska’s corn crop was rated 76% good-to-excellent during the first week of August and managed a final state corn yield last year of 178 bpa, 5 bpa BELOW NASS’s forecast on Thursday. This pattern largely holds true for the other 3 aforementioned states.
The question then becomes “What use are the USDA’s weekly crop condition reports if they can’t help predict even ball-park assumptions on state yield potential?” Therein lies the frustration and confusion from both spec and hedger alike moving forward as it relates to being largely unable to draw any meaningful yield conclusions from the USDA’s current 2017 good-to-excellent ratings.
That said I was reminded of some keen trading advice I received over 10-years ago following what was then a similar market reaction to a USDA/NASS crop production report, which also appeared at the time unsubstantiated relative to “eye-witness” field reporting. love THEM or hate THEM you have to trade the USDA’S numbers. Arguing with the USDA has never been and likely never will be a winning proposition. I’ve learned that the hard way over 18 years of trading Ag commodities. Therefore with that in mind here’s the reality of the current situation:
- Looking ahead to the September Crop Production report, since 2004 the USDA has only lowered the U.S. corn yield from August to September on 5 different occasions, the largest yield cut coming in 2011/12 totaling -4.9 bpa. This would seem to suggest a U.S. corn yield revision down to 164 to 165 bpa remains a possibility for September, however even that type of yield reduction would still leave 2017/18 U.S. corn ending stocks of 1.82 to 1.90 billion bushels. That doesn’t equate to December corn futures above $4.00 per bushel.
- The other major problem for Corn Bulls is the Managed Money was both long and wrong going into this report. As of August 1st money managers were still carrying a net long in corn of nearly 85,000 corn contracts. That said they undoubtedly sold off a large percentage of that position on Thursday (fund selling was estimated at over 30k contracts on 8/10). I would expect them to continue liquidating their long positions in the days to come, possibly even looking to establish a new net short position in corn going into September.
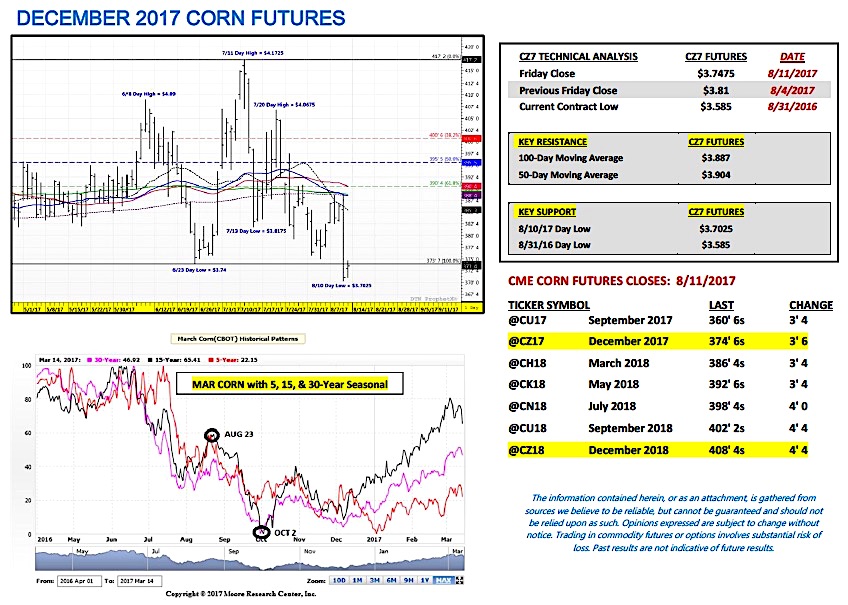
- And finally from a technical chart perspective, the December corn chart was shredded by Thursday’s close with CZ7 closing 3-cents below the previous 2017 calendar year day low of $3.74 from June 23rd. Furthermore the seasonal pricing pattern in corn futures in the 5, 10, 15, and 30-year patterns is lower from the end of August through essentially the first week of October. I could see a case where corn moves sideways for the time being; however without the Managed Money engaged on the long side, along with an old-crop cash long that still needs to be priced and moved prior to the 2017 corn harvest…20 to 30-cent recoveries in December corn futures now seem to be facing a steep uphill battle.
Thanks for reading and have a great week.
Twitter: @MarcusLudtke
Author hedges corn futures and may have a position at the time of publication. Any opinions expressed herein are solely those of the author, and do not in any way represent the views or opinions of any other person or entity.
Data References:
- USDA United States Department of Ag
- EIA Energy Information Association
- NASS National Agricultural Statistics Service

: Worrisome to Broader Market?")
