Gold prices have struggled a bit of late and the charts are demanding some attention here. Today I’ll look at Gold via the SPDR Gold Shares ETF (NYSEARCA:GLD) and highlight a few reasons why the yellow metal looks bearish here.
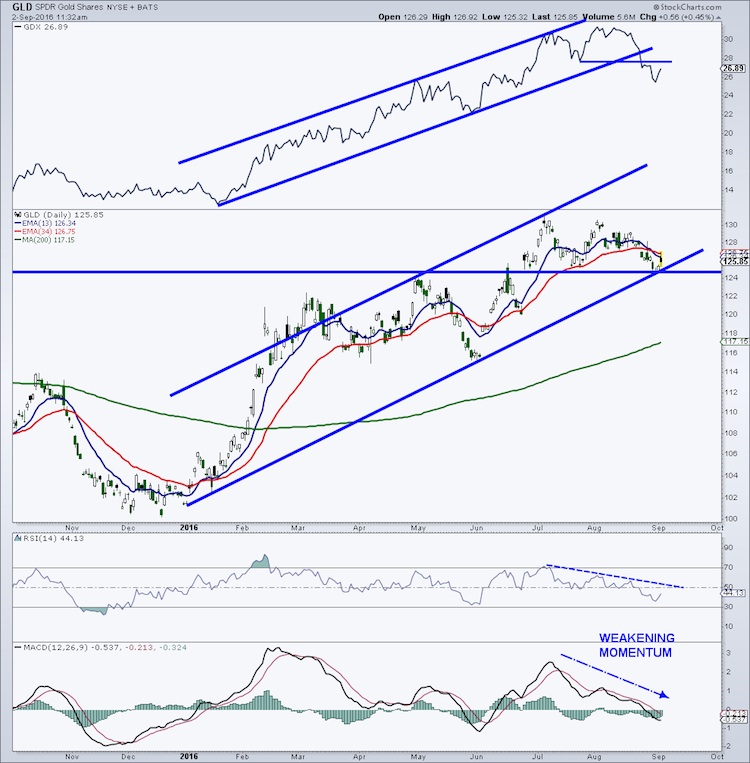
Looking at the chart below, GLD has bounced off initial chart and trend line support in the 124 area in what could be a completed ABC pullback. However, note that the Gold Miners Sector ETF (NYSEARCA:GDX) has broken down a bit more than GLD. This is typically a warning of further weakness ahead for the yellow metal.
If the recent low on the Gold ETF (GLD) gives way, we could finally see some downside acceleration. Should this occur, GLD could easily fall to the 120 area or perhaps all the way down to its rising 200-day moving average at 117+. Daily momentum indicators are bearish with the declining 14-day RSI below 50 and the daily MACD in negative territory.
It is worth noting, though, that a break above the recent high at 131.15 would be bullish.
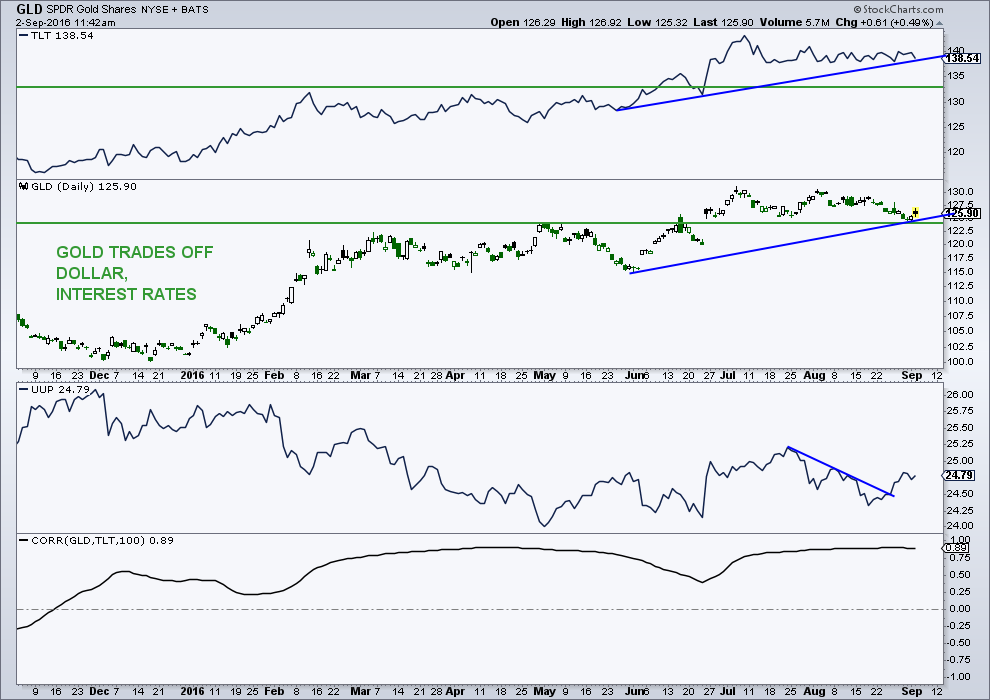
The major tailwind for gold prices has been the consistent decline in treasury rates. Note the high correlation on the bottom panel of the chart below. Since treasury rates have stopped falling, GLD has stopped rising. If the longer-term treasury bond ETF (TLT) breaks down, which I am expecting, gold prices (and GLD) could get smacked pretty good. I have no technical edge on the U.S. Dollar Index other to say it remains rangebound.
If interested, you can contact me at arbetermark@gmail.com about my premium newsletter.
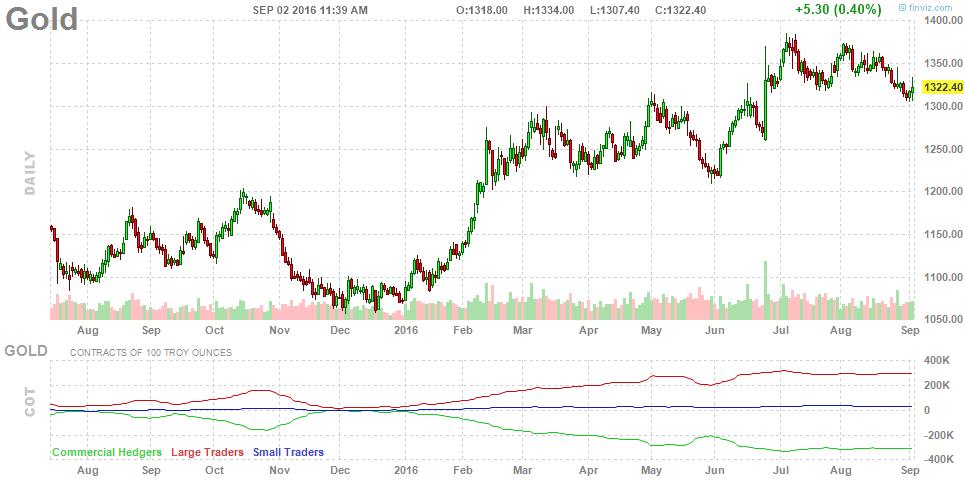
As I have been saying for quite some time, the COT data for gold is very bearish. Smart money commercials are extremely bearish while the large speculators are quite bullish.
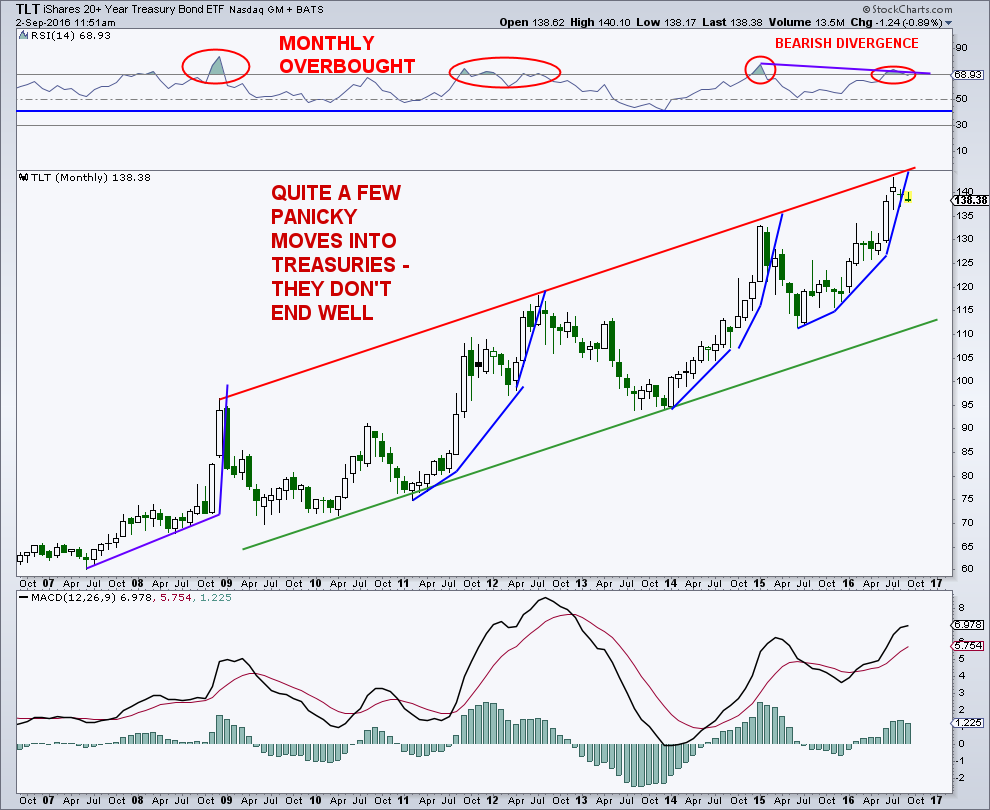
I think the monthly Treasury chart speaks for itself. I’m still expecting a large correction here. Note that I am short treasuries via a small TBT position.
Thanks for reading.
Twitter: @MarkArbeter
The author has a long position in TBT at the time of publication. Any opinions expressed herein are solely those of the author, and do not in any way represent the views or opinions of any other person or entity.


")

 Rolling Over At Key Fibonacci Level?")

