The stock market as we know it tilted in March of 2018, then shifted in April.
We witnessed and gave testimony that some stock market indices were experiencing a new, new. And we highlighted several reasons and charts for a Dow Jones Industrials Index and ETF top (INDEXDJX:.DJI / NYSEARCA:DIA).
A shift had begun with the newly confirmed Double Bottom chart pattern that formed in the Monthly Interest Rates on the Ten year notes (INDEXCBOE:TNX)
It is not popular to say there will be fewer sunny skies for a while (in some places of the market) but we deal with what we have been given. We take what the market gives, and work diligently to show how not to give it back.
Here are our previous posts on the Dow Jones Industrials and 10-Year Treasury Yield:
Specific mathematical numbers over time, repeatedly reveal major turning points in the market or an asset. We utilize technique’s passed down from generation after generation that assist in providing a time for the start or end to a cycle.
THE DOW JONES INDUSTRIALS
Our condolences to the Dow were made in our April call that the analysis repeatedly signalled the end of this Unicorn’s Bull run for the time being. The mathematical perfection of 1.618 had been three times expanded to 3.618 and after a trifecta in price; its cycle reached a point of completion.
Markets tend to make turns at numbers; that when squared, are whole numbers.
No change in our original call from April, that the Dow Jones Industrial Average made it’s TOP.
The 3.618% Fibonacci Ellipse has proven so far to be a barrier.
Here is an update utilizing Andrew’s PitchFork layered on top. Notice the resistance at the top parallel line of the Pitchfork is located precisely at the same resistance on the Spiral using a 2.786% parallel to the median line.
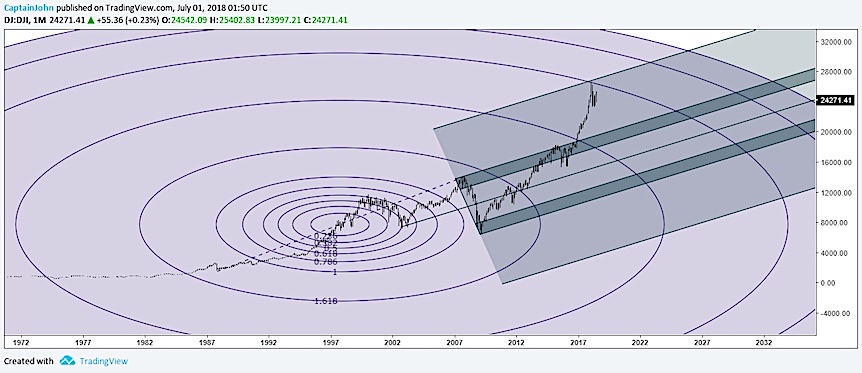
Why is 2.76% such an important number?
The sequence 2.76 aims for the number .382 which is an inverse of the square of the golden mean. According to Stakhov Alexey, “botanists find different plants have different ratios of the 2.76 sequence and phyllotaxis law proves that this disposition of leaves allows for maximum inflow of solar energy to a plant.”
It is the sum of twelve consecutive prime numbers.
276= 15+ 25+ 35
The Hebrew word for evil equals….276 (vau=6, resh=200 ayin=7)
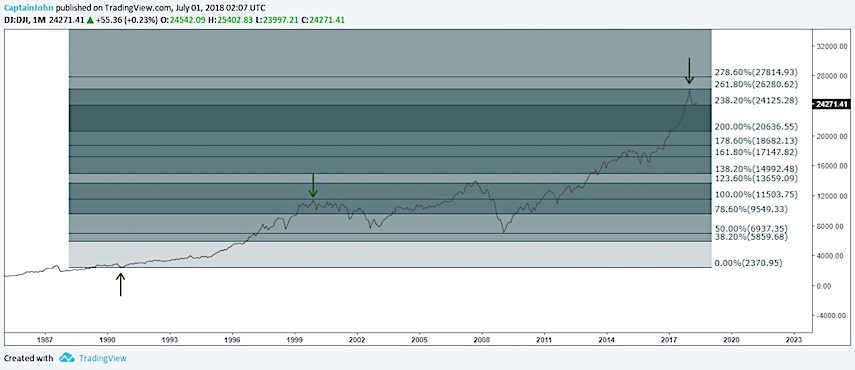
In the monthly Dow chart above, a Fibonacci extension is overlaid with arrows indicating the start and the end of the the bull market. The first arrow is when the Gulf war started, putting a bottom in the market, opposite of what logic dictates in the mind of an investor.
Bull markets are born on pessimism like the beginning of the gulf war, and die on optimism as in this case the 2000 euphoric technology top.
The extension shows that once price hit a major Fibonacci number 261.80%, (a number that acts as a future area of support or resistance and a product of the Golden Mean 1.618 x 1.618=2.618) it immediately turned down.
The 1.618 squared on the New Moon marks a switch in polarity. No buying on the new. This is opposites day. Price resisted at the 261.8 % level, in a “strong” market, at a high and on the day of a New Moon. That, is not bullish.
Where does the Dow stand now?
We noticed on a Weekly chart of $DIA, that there has been a lot of selling on the New Moon lately.
Don’t scoff at my mention of the “Moon” and market esoterica until you’ve read the studies that go back decades. Starting seven days before and seven after the new moon, average returns are much higher. There’s a 10% a year on average difference in returns from the Lunar Effect that exists across all major Indexes. The data goes back to the start of the Dow in 1896. The caveat is that this should not be used as a sole investment decision tool as it produces losses 40% of the time.
Studies agree on the critical point that starting seven days before a New Moon and ending seven days after, the market returns are about double the returns in the 15 days surrounding full moon dates.
Coincidentally (or not) the bible in 1 Samuel 20:5 says: “So David told him, “Look, tomorrow is the New Moon, and I am supposed to dine with the king. Instead, let me go and hide in the field until the third evening from now.”
Jamieson-Fausset-Brown Bible Commentary (5.)
So greedy are they of unjust gain that they cannot spare a single day, however sacred, from pursuing it. They are strangers to God and enemies to themselves, who love market days better than sabbath days; and they who have lost piety will not long keep honesty. The new moons (Nu 10:10) and sabbaths were to be kept without working or trading (Ne 10:31).
If market returns are higher around new moons, you may be wondering why this is not the case at this time.
We often see market tops or bottoms and changes in market direction near a New or Full moon. In addition, the semi annual lunar eclipses can become a place we can look for major market moves. The Full Moon on January 31, 2018 was followed by a loss on the Dow of almost 2,000 points.
A New moon can also mark the start of a new cycle and this bull market was not driven by natural law, but by excessive liquidity. Nothing natural about that.
The combination of arriving at 276% Fibonacci coupled with the New Moons recent pattern,resulting in days of selling is one thing; the other is the Hellcat Triangle Pattern that has formed.
Price of the Dow will soon be coming back to meet the Resistant Upper Downtrend line. That appointment date is timing up with the coming New Moon.
Price left a comfortable bullish universe and pattern of just going “up” and into a new paradigm of a Bearish Hellcat Triangle. These wicks have violent long sticks and rocketing bounces. Each subsequent sell has been on the new moon. Esoteric or not price rejected itself on those days now twice already.
What will happen this Third go at it that falls precisely at the New Moon and the following days Solar Eclipse?
Take a look at the red up trend inside the Hellcat Triangle for a moment and you’ll see it leads directly to another New Moon on September 9th. If we retest this upper resistance and it heads back down, we would be watching for a bounce on this red line and the subsequent grand finale of clarity about whether it will reverse and break out, all of which will time out to coincide with the September 9th, New Moon.
The Universe belongs to mathematics and Fibonacci is the mathematics of the universe. The math above, is as it is below, on Earth. The markets like to turn dramatically on the square root of prime numbers and will reject or defy key Fibonacci levels. Price not only has a memory, it has a resonance and energy that is a cumulation of the resonance and energy of the buyers and sellers.
If ever there were a time to reveal “problems” and gain clarity this would be it. The Hellcat Triangle assures that this most definitely could be Heaven or this could be Hell.
Twitter: @CptJohnCharts & @FortunaEquitis
The author may have a position in mentioned securities at the time of publication. Any opinions expressed herein are solely those of the author, and do not in any way represent the views or opinions of any other person or entity.


: Showing Some Signs of Emerging Strength")
