We know there’s something going on in the Dow Jones Industrials…
Since there will be a follow up post coming, we’ll call this part I.
What a rip it’s been since Six Hundred- Sixty Six on the S&P 500. Let’s look though, at the most widely followed US stock market Index; The Dow Jones Industrial Average.
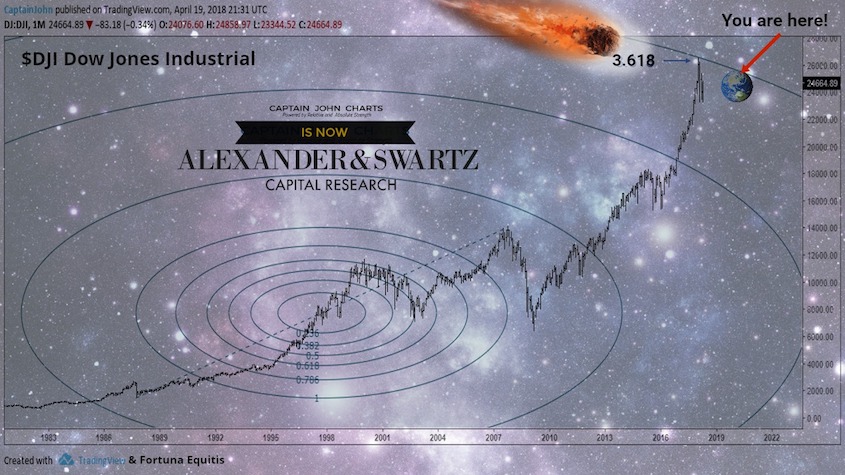
The Unicorn Bull has flown to close to the sun. It blew past our meager universe and went 3.618 light years creating an epic run. Then as if hitting a wall, recoiled and turned n’ burned to the downside. (see chart below)
But look where this stopped! This is the dark of the moon. This is the last stop leaving the station.
This is congruent with many other indices in various time frames and various Fibonacci targets have been hit RIGHT ON THE X SPOT!
In Part 2 forthcoming, we will illustrate in depth analysis of other indices using hundred-year-old techniques that have lived longer than us all.
Have you ever been experienced?
Well we have.
We have lived through the worst stock markets filled with incredible blow ups and swans of every color but this one…IS different. It is best explained by the Fibonacci circle/ellipses overlaid below in the Dow Jones Industrials “Monthly” stock chart.
Fibonacci circles or Ellipses are patterns that evolve from important trend lines that move out from a trend line. In this case, we look at the 1987 crash low, up to the 2007 Financial Blow-Off highs.
These numbers are often rounded to 38% and 62%.
The middle arc is set at .50 or 50%.
After an advance, Fibonacci Arcs are measured using a Median that extends from bottom to top. Circles are drawn along this line with radius that measure .382, .50 and .618 of the trend line.
The circles mark potential support or reversal zones to watch; as prices pullback after the advance. After a decline, Fibonacci circles are used to anticipate resistance or reversal zones for the counter-trend bounce.
Do You See What we See?
The outer ring is 3.618, a triplicity of the harmonic perfection of .618. Price decided precisely at this important mathematical number that perfection was achieved.
Ladies and gentlemen, our research says the party is over. The Top Is In.
I am preparing for a long, long frustrating market ahead. Stay tuned for Part II.
Please note that Captain John Charts is now Alexander and Swartz Capital Research. Our research is all about maximizing ones assets and growth; even in the worst of environments.
Twitter: @CptJohnCharts & @FortunaEquitis
The author may have a position in mentioned securities at the time of publication. Any opinions expressed herein are solely those of the author, and do not in any way represent the views or opinions of any other person or entity.


