How Can This Help Us In 2016?
The charts above assist us with probability of the S&P 500 going on to make a new all-time high in 2016. The weaker trend in 2016, relative to 2011, tells us the odds of new highs are lower today than they were in 2011/2012.
Could the S&P 500 rally and exceed the May 2015 high of 2,134? Sure it could; the term probability implies that positive and negative outcomes can occur from any market profile.
Have The Trends Improved Since The February 2016 Low?
The present-day profile can be summed up with the 50-day and 200-day shown below after the big rally on March 1.
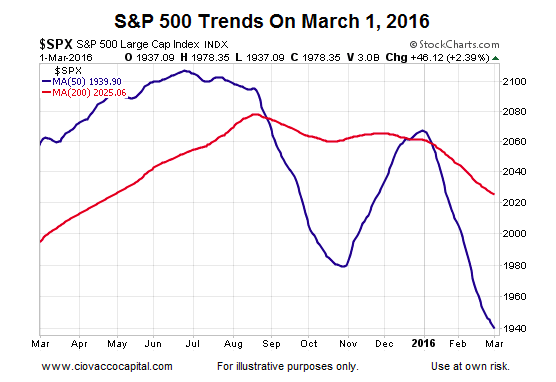
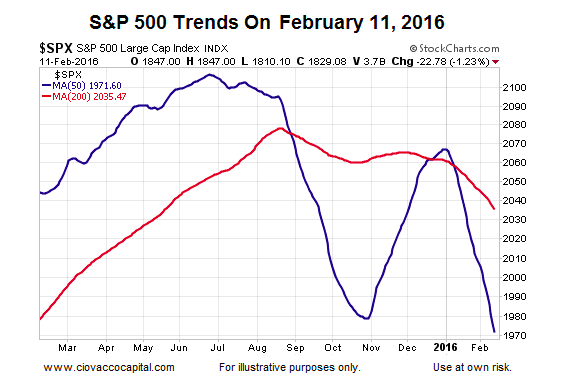
If we examine the same moving averages on February 11, 2016 (the day of the most recent low), we see the stock market trends were weak then and they remain weak today. The intermediate and longer-term stock market trends may begin to improve very soon, but it is has not happened yet. Under our approach we need to see improvement rather than anticipate it.
Thanks for reading.
Further reading from Chris Ciovacco: “What History Says About Fed Rate Hike Cycles And Stocks“
Twitter: @CiovaccoCapital
Author or his funds have long positions in related securities. Any opinions expressed herein are solely those of the author, and do not in any way represent the views or opinions of any other person or entity.


