Gathering Perspective From Past Fed Rate Hike Cycles
Based on 30-day Fed fund futures prices, the CME Group estimates a 74% probability the Federal Reserve will raise interest rates in December after keeping them steady for years.
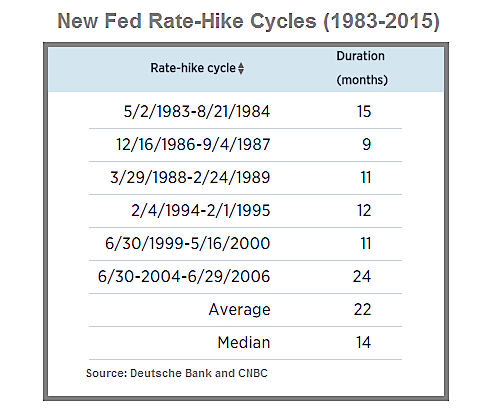
From a historical perspective, the table below shows the dates when the Federal Reserve began to raise interest rates following a period of keeping rates steady.
If the Fed raises rates on December 16, we would need to add that date to the list below.
Markets Have Numerous Questions To Ponder
In this article, we will walk through all of the periods listed in the table above beginning with 1983. Before we begin that process, it is important to put some context around the market’s thought process when the Federal Reserve shifts policy from “no change” to “increasing rates”.
When the Fed is getting ready to shift policy or they have recently shifted policy, the financial markets are continually asking countless questions, including:
- Is the economy strong enough to handle higher interest rates?
- How will the bond market react?
- How will the stock market react?
- Will the Federal Reserve raise rates again at the next meeting?
- Will the Fed push the economy into a recession?
- What will the impact be on earnings relative to current valuations?
- Is inflation contained or will it become a problem down the road?
- Will a rate hike push the economy into a deflationary spiral?
- How will inflation impact the economy, stocks, global markets, and earnings?
If we built decision trees based on the questions above, you can begin to imagine the immense number of permutations and combinations of answers and subsequent paths in the financial markets, which puts some context around the market’s indecisive and whipsaw behavior in 2015. As we go through the historical examples of Fed rate hike cycles below, it is easy to see that it is quite common and rational for markets to be more difficult and indecisive when the Fed is opening up an almost limitless number of “what if” scenarios as they begin to shift interest rate policy.
How Did The Market React To The First Rate Hike?
The Federal Reserve kicked off a new rate-hike cycle on May 2, 1983. The first thing that jumps off the chart below is the stock market was indecisive, going up and down, but making no progress between May 1983 and December 1984 (sound familiar?). In 2015, the stock market has gone up and down, but has made no progress between December 2014 and the present day. The S&P 500 closed at 2090 on December 29, 2014. On November 18, 2015, the S&P 500 closed at 2083, which speaks to the market’s ongoing indecisive behavior.
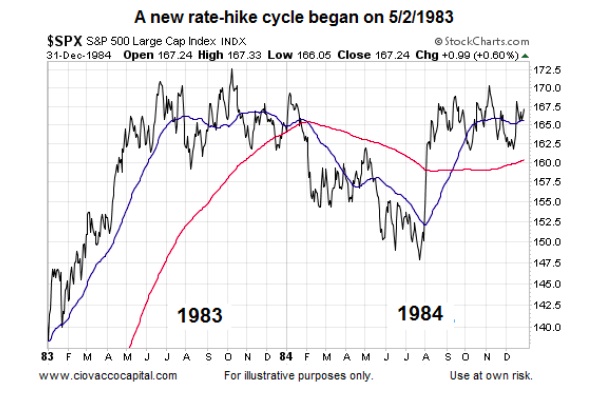
Before we move to the “what happened next” chart, take a moment to make a mental note of the “look” of the 50-day and 200-day moving averages in the indecisive 1983-1984 chart above prior to the beginning of Fed rate hike cycles. The 200-day in red goes from bullish, to bearish, to indecisive (flat). The 50-day in blue is all over the place, telling us we have a trendless market.
Hard Period Followed By An Easier Period
It is not uncommon to experience a difficult and frustrating market when the Federal Reserve shifts policy, which is the bad news. The good news is hard markets are typically followed by easier markets. Said another way, trendless and indecisive markets are usually followed by stock markets with much more discernible trends and greater investor conviction.
The pattern held true to form in 1983-1987 (see chart below). Notice how the slope of the 200-day clearly shifts from flat in late 1984 to up/bullish in early 1985. The same can be said for the 50-day moving average; it goes sideways inside the orange box, but then shifts to a series of higher highs and higher lows between early 1985 and mid-1987.
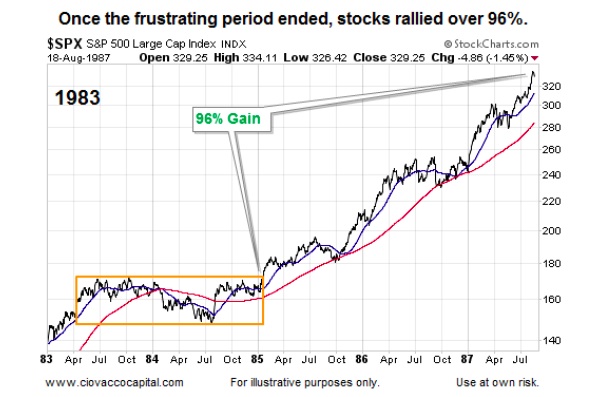
Therefore, under our market model-based approach, if we would have continued to execute faithfully and consistently during the frustrating period (orange box above), we would have eventually been rewarded with positive results. The same can be said for any disciplined and rules-based approach to the markets.
Just Buy And Hold…Right?
You may say who cares?….if you just buy and hold, when the frustrating period ends you will be fine. That sounds good until a bear market in stocks comes… more on that later.
1986: Indecisive Market Anticipates Fed Policy Shift
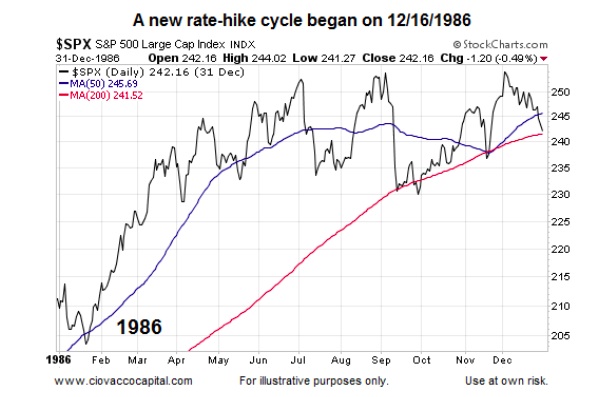
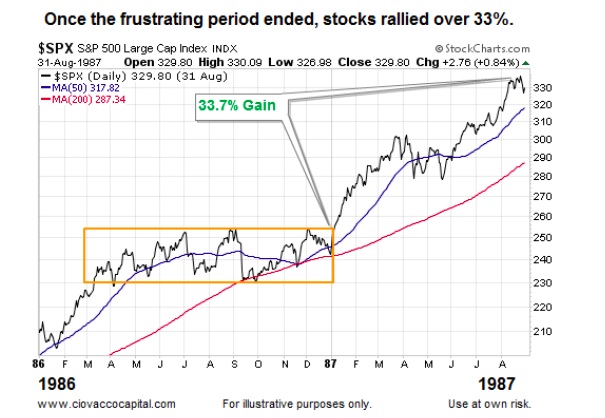
The Federal Reserve began one of its fed rate hike cycles on December 16, 1986. Prior to the December 1986 federal reserve interest rate hike, the S&P 500 went up and down, but made no progress between March and November 1986, similar to the indecisiveness of stocks in 2015. Notice how the 50-day moving average moved into a sideways pattern prior to the rate hike. The 200-day also started to flatten out in late 1986, similar to what we have in November 2015.
1986: Eventually, The Logjam Broke
Discipline and patience were rewarded in 1987 as the stock market rallied 33.7% over the next eight months. The 1987 crash is not shown in the chart below for a reason; stocks rallied significantly for several months following the rate-induced indecisive period.
continue reading on the next page…


