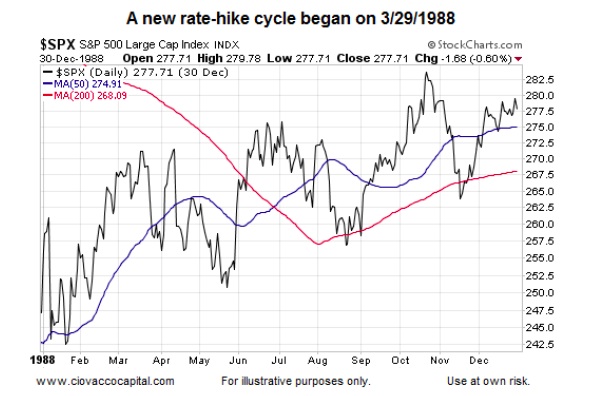
1988: Volatility & Whipsaws
The Federal Reserve began a new rate-hiking cycle on March 29, 1988.
The slope of the 200-day moving average in the first half of 1988 tells us the market’s profile was quite a bit different than the first six months of 2015. Similar to the previous historical examples, the stock market showed some erratic behavior in 1988, making no progress between January and June, and again between mid-June and early-December.
The slopes of the 50-day and 200-day in December 1988 tell us the bias was bullish heading into 1989. Price action in 1988 also featured higher highs and higher lows in stocks.
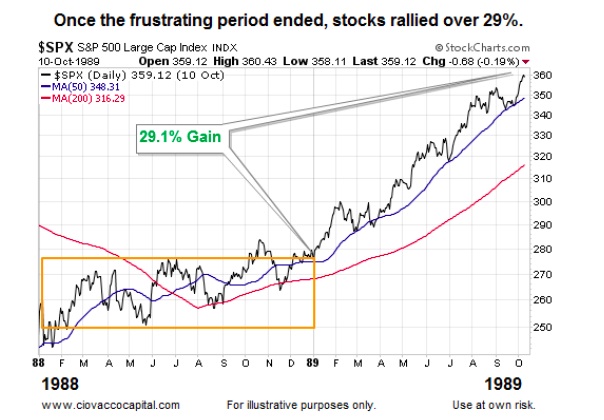
1989: Gains Were Easier To Capture
The orange box shows a more difficult and indecisive market near the first Fed rate hike. Following the pattern of easier markets tend to follow harder markets, stocks rallied sharply within the context of more easy to discern trends in 1989. Those who executed well inside the orange box were rewarded for their perseverance.
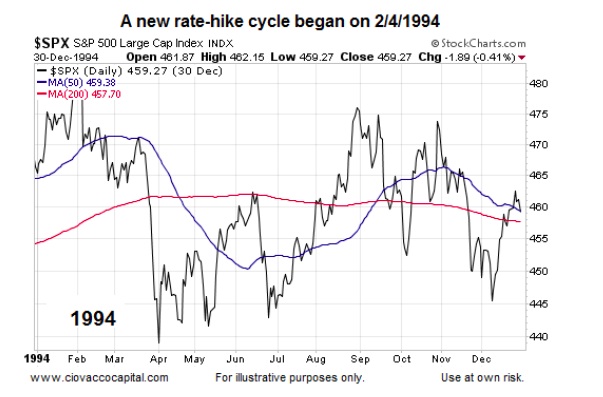
1994: Frustrating, Volatile, And Sideways
Similar to what may occur in 2015, 1994 was marked by the first fed rate hike in a number of years. When the Federal Reserve raised rates on February 2, 1994, it represented the first interest rate increase since early 1989 and a new fed rate hike cycle.
As the market anticipated a “we have not seen this in a long time event”, it understandably was indecisive and volatile as it went through the list of common “how will this impact…” questions. If you were running a system based on trends in 1994, it would have been easy to conclude “this does not work”. Like 2015, 1994 can be classified as a trendfollower’s and systems trader’s nightmare.
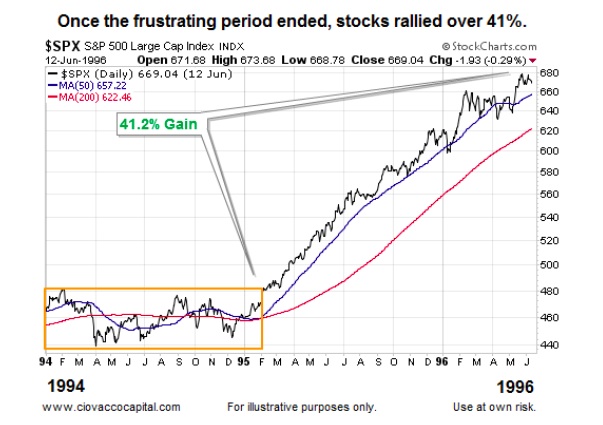
All Bad Things Come To An End
Markets want to frustrate us. Markets want us to question our process and discipline. Markets can serve as confidence-destroying machines. Nothing is more frustrating than breaking your rules or throwing in the “this does not work” towel just prior to a big “hey, discipline really does pay off!” move. Those who stayed the course with their rules and discipline in 1994 were rewarded big time in 1995 and 1996. 1994 was the harder market; 1995-1996 was the easier market with easier to discern conviction and trends. Harder markets are typically followed by easier markets; something to keep in mind before you throw in the towel in 2015 and 2016 on stocks.
Easier Markets Can Take The Form Of Bearish Trends
Many who use investing and trading systems can relate to this expression:
“We don’t care which way the market goes, up or down; we just want something to trend somewhere on our timeframe.”
When stock markets consolidate, or move sideways in an indecisive manner, the expression below applies:
“The longer a market goes sideways, the bigger the move we can expect, up or down.”
The up or down concept applies to the next historical example.
1999: All Good Things Come To An End
Is it possible the Federal Reserves raises interest rates in December 2015 and stocks rally to new highs only to quickly reverse and enter a multiple-year and principal-destroying bear market? Sure, it is possible. The Federal Reserve began a Fed rate hike cycle in the summer of 1999. The S&P 500 made no progress between January 1999 and October 1999. The flat 50-day moving average in the middle of 1999 is indicative of a trendless and frustrating market.

2000: Fed Rate Hike Followed By Devastating Bear Market
The purpose of this post is not to say “stocks go up” after the first rate hike. Given the charts presented here, it is fair to say “stocks typically go up after the first rate hike, but not always.” The exception was 1999-2000.
The Federal Reserve started a new Fed rate hike cycle in June 1999. As shown in the chart below, stocks did gain about 8% once the S&P 500 left the orange box, but the easier trend eventually was to the downside. The 200-day rolled over in a bearish manner in late 2000 and the 50-day dropped below the 200-day (both bearish events). The primary trend eventually flipped to down following the more difficult period.
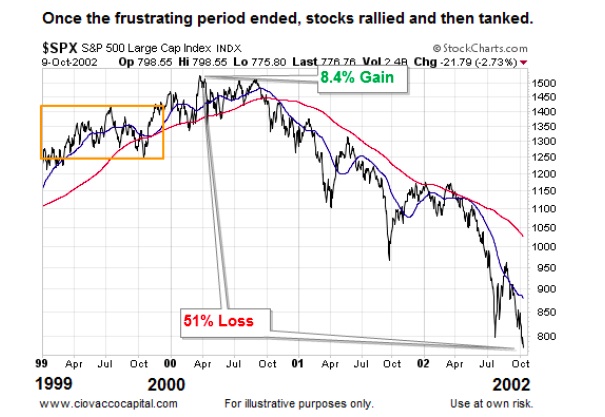
Those who continued to implement their disciplined systems in 2000 were eventually rewarded as a strong downtrend emerged. Discipline can keep you on the right side of the trend, regardless if the trend is up or down.
Pie Charts, Buy & Hold, Bear Markets and Retirement
It is not a question of “if a new bear market is coming”, it is just a question of “when will the next bear market ins stocks begin”. If that is the case, it makes sense to water-test your diversified investment portfolio for leaks. We provided a similar “now is a good time to look at this” warning on December 29, 2006 or less than ten months before the financial crisis. The 2006 article, False Diversification May Prove Costly In 2007 showed that what appeared to be a well-diversified portfolio of ETFs or mutual funds lost over 42% in the 2000-2002 bear market. A 2015 analysis, Retirement Investing, 4% Rule, & Drawdowns answers the following important questions:
- How can a bear market impact monthly income in retirement?
- How long can it take to get back to breakeven after a large bear market drawdown?
- Does a diversified mix of ETFs or mutual funds really provide diversification?
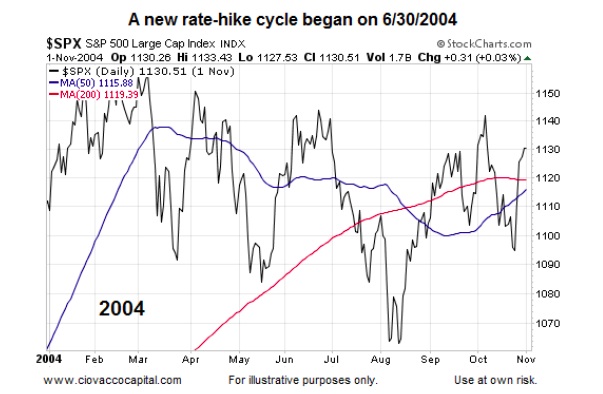
2004: Nightmare Number Two
The historical examples presented here tell us 2015’s frustrating market is not all that rare when it comes to new Fed rate hike cycles. The U.S. central bank began a new rate hike cycle by raising rates on June 30, 2004. Like 2015, 2004 featured some big swings up and some big swings down; it also featured a “go nowhere” stock market with the S&P 500 making no progress between January and November. Those implementing investment or trading systems in 2004 may have rationally begun to say to themselves “this does not work” as they experienced whipsaw after whipsaw. Notice at the end of 2004 the slope of the 200-day was flat, indicating an indecisive market from a long-term trend perspective. The slope of the S&P 500’s 200-day moving average is also flat as of November 19, 2015.
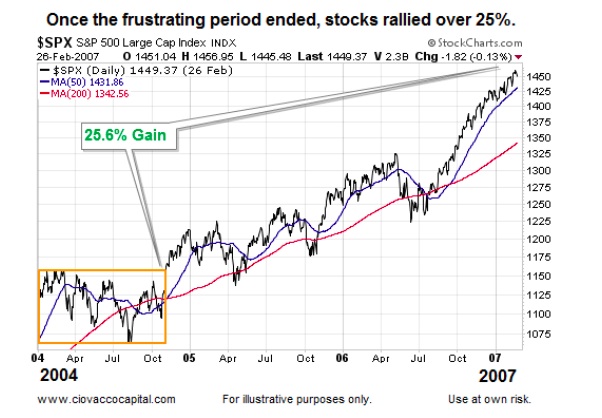
Late 2004: Observable Evidence Begins To Improve
The observable evidence began to improve in late 2004 as the slope of the S&P 500’s 200-day began to turn back up in a bullish manner, something that can be picked up by a disciplined model. Once the market broke above the orange box of indecisiveness below, the slope of the 50-day turned up sharply and the slope of the 200-day morphed from flat (indecisive) to rising (bullish). The slope of the 200-day moving average between 2005 and early 2007 is indicative of a bullish and more easily discerned trend (stronger investor conviction). Like 2015, 2004 fell into the trendfollower’s nightmare category, but it also followed the hard markets are typically followed by easier markets script. Notice easier is not the same as easy; there is no such thing as an easy market.
What Happens If Sideways Action Continues?
Most trading and investment systems have whipsaw provisions. Our market model has various levels of whipsaw rules that are designed to limit trading frequency and whipsaws during periods of consolidation (see April 1 to mid-August 2015). In the present day market, when stocks rallied off the recent low and recaptured the 200-day moving average, the 1998-like scenario was still within the probability mix. Stocks rallied for six straight weeks off the low. The following week the S&P 500 dropped in a manner not seen since 1939 (weekly performance following six weeks of gains). That sharp drop took the 1998 “stocks blow past the 200-day and never look back” scenario off the table. It is possible the stock market is going to return to a period of consolidation. If so, whipsaw rules will enter the picture under our system to reduce the frequency of allocation adjustments.
Moral Of The Story: Consistent Execution Key To Success
Remember:
- Markets want to frustrate us.
- Markets want us to question our process and discipline.
- Markets can serve as confidence-destroying machines if we break our discipline.
We know two things with 100% certainty. If the S&P 500 rallies for three years and goes on to make much higher highs, the slope of the 200-day will not remain flat as it is today; it will turn up in a bullish manner. Conversely, if the S&P 500 is getting ready to enter a three-year bear market producing significant lower lows, the slope of the 200-day will not remain flat as it is today; the slope will turn down in a bearish manner.
Is the 200-day a foolproof indicator? No, but the same logic applies to numerous indicators and hard data points. Price, the moving averages, and the hard data will not miss the next big move, which is why consistent and diligent implementation of investment and trading systems can keep you aligned with whatever trend comes next (bullish or bearish). The evidence will not miss the next move, but many well-intentioned investors and traders will.
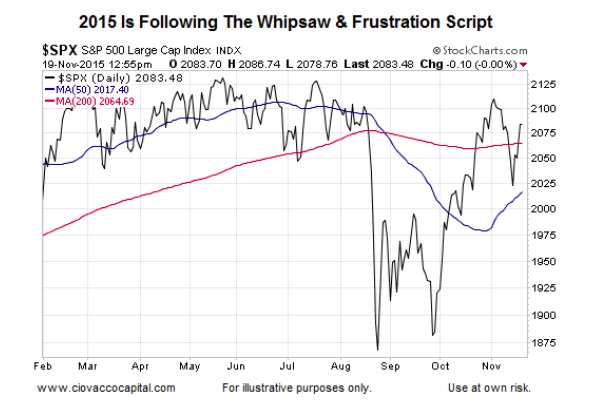
2015: Indecisiveness Is Not All That Rare
The stock market has seen countless “this has never happened in our lifetime” events in 2015. Therefore, we do not want to discount the degree of difficulty over the past year. However, to say “the market is broken and acting irrationally” does not really mesh with the historical beginning of past Fed rate hike cycles (and examples) above. It is quite common for markets to be confused/difficult/frustrating when the Fed opens countless “what if” doors caused by a major shift in interest rate policy. The other thing that is consistent from a historical perspective is that:
Difficult periods in the stock market are typically followed by easier periods, which underscores the need to continue to stay the course and execute in a consistent manner.
Thanks for reading.
Twitter: @CiovaccoCapital
Read more from Chris on the CCM blog.
Author or his funds have long positions in related securities. Any opinions expressed herein are solely those of the author, and do not in any way represent the views or opinions of any other person or entity.
: Creating Bullish Divergence?")


 and Semiconductors (SMH): Concerning Price Pattern?")


