Update on DeMark “tells” for Oil
Once again, the credit market provided the tell-tale sign that crude oil’s sideways consolidation during the last couple of weeks of November was going to be just a pause before another plunge.
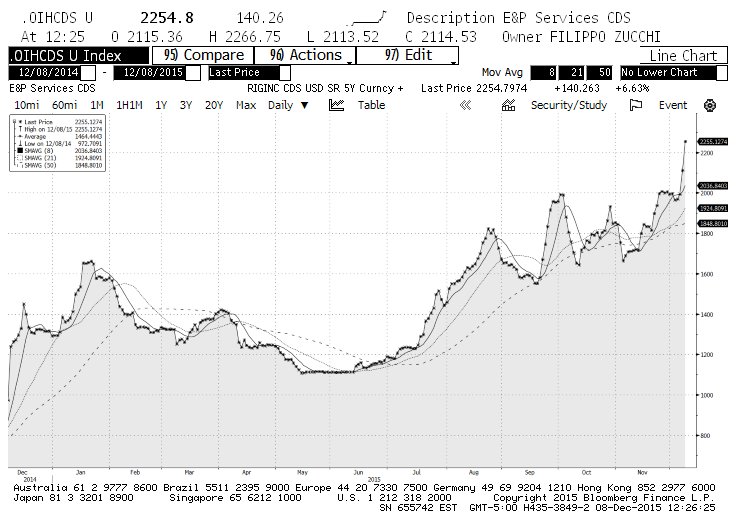
As you can see from the charts below, while crude oil prices were dragging along the bottom, the CDS’ of Oil Services (see ticker OIH) sensitive stocks kept steady near years’ wides, suggesting that the oil market remained as “sick” as it has been in a long time.
Oil Services (OIH) CDS Chart
Now that Crude Oil prices have broken to new lows (and credit to new wides…by a lot) the obvious question is “what’s next”. Looking at DeMark analysis and some DeMark based charts, let’s just say that things don’t look very good for bulls.
On a daily basis, on Tuesday the price printed bar 8 of yet another DeMark Buy Setup. To cancel the Setup, crude oil prices would have to close on Wednesday above $41.08. If the Setup completes, then we should expect a pause for a few days, but completion would be more evidence of the relentless selling pressure in the commodity.
Crude Oil Prices – Daily DeMark Chart
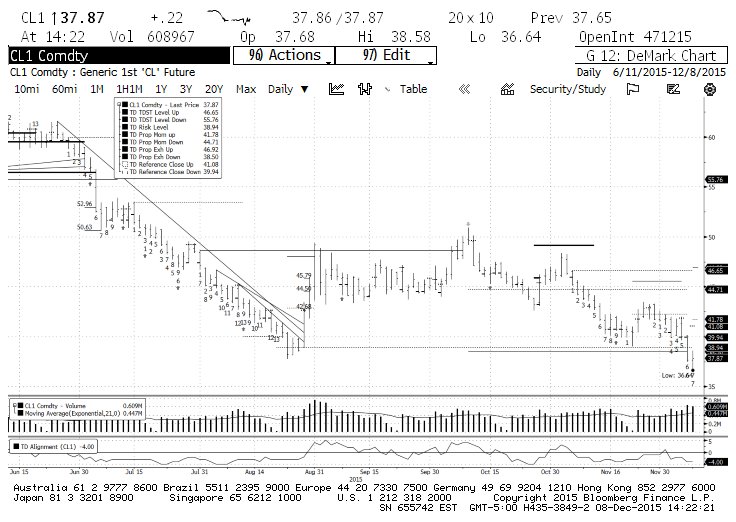
Two more items might stabilize the price of Crude Oil in the near term. First, $37.27 is the DeMark “Risk Level” (secondary exhaustion level) of the last completed TD Sequential Countdown Buy that printed in early August. Risk Levels can be interpreted as important price support areas.
If this DeMark level breaks – especially if the break is “qualified” – it would be very very bearish. Second, price is approaching bar 8 of the active Sequential Countdown Buy. Bar 8 is where price usually rallies in the opposite direction, before the final move to bar 13. It’s also why one of the requirements of Countdown completion is that Bar 13 touch below (or above in the case of a Countdown Sell) the high of bar 8.
If you are confused, I’ll cut to the chase: there are multiple technical reasons why oil may be seeing the lows for this calendar year.
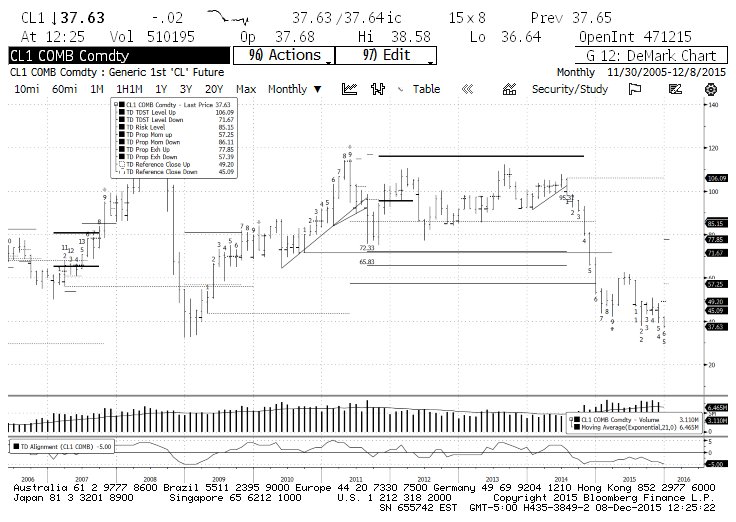
Longer term however, the action remains ominous. Below is the monthly DeMark chart showing a qualified break of TDST Level Down (all the way up $71.67), a completed Buy Setup (Bar 9 on the right), bar 6 of an active Buy Setup and Bar 5 of a Countdown Buy. If the current Countdown completes to bar 13 (as expected given the “qualified” break of TDST Level Down), there’s A LOT of downside risk left in the oil market. How much lower is difficult to tell at this junction, but some broken weekly TD Lines (think “trendlines”) target the $28 and $22 areas.
Continue watching credit of energy sensitive securities as the key tell for oil, and careful trying to catch falling knives.
Good luck and good trading to you!
Twitter: @FZucchi
Author does not have a position in the mentioned securities at the time of publication. Any opinions expressed herein are solely those of the author, and do not in any way represent the views or opinions of any other person or entity.


 Flirting With Critical Support… Again")


