In our April post on this topic, we showed how the crude oil rally from last year’s low was probably nearing its end.
Although price tested some resistance levels above those we mentioned last time, the five-wave form now appears complete or nearly so for the United States Oil Fund (NYSE Arca: USO).
So the recent price reversal to the downside is a concern for Crude Oil bulls.
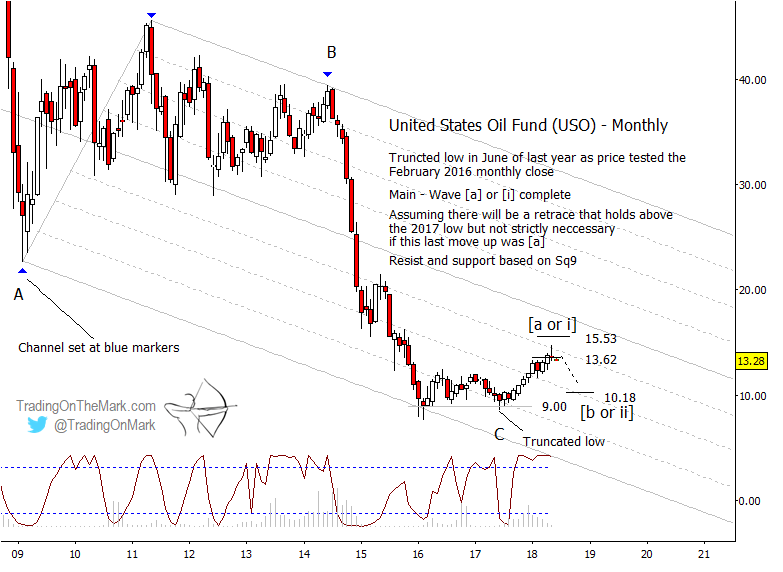
On a monthly chart of USO, price tested and closed beneath the Gann square-of-nine resistance level at 13.62. A similar resistance level hovers overhead at 15.53, but there’s a good chance a reversal will kick in before the higher level is tested.
Keeping with the big picture, a downward retrace from near the present area should cut into a substantial part of the rally from 2017.
A prominent Gann support level awaits at 10.18, and it is conceivable that price could even push beneath the 2017 low of 9.00 as part of a corrective pattern.
United States Oil Fund (USO) – Monthly Chart
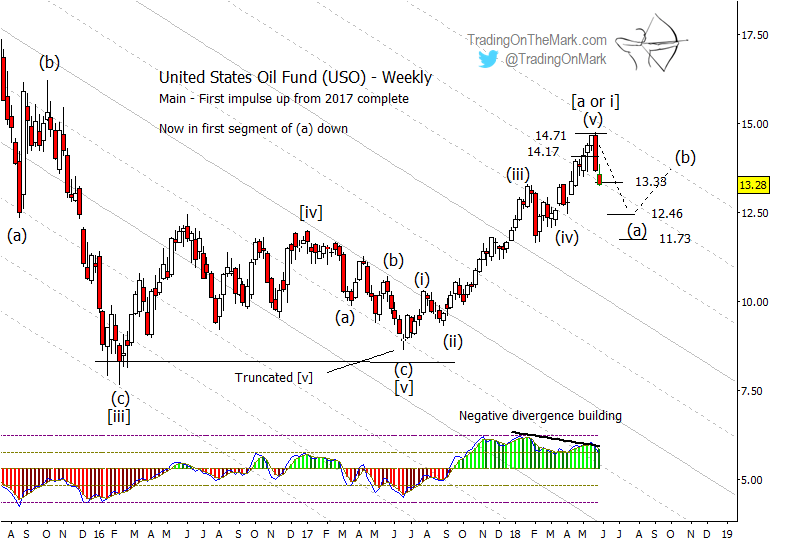
A weekly chart makes it easier to see how the rally can be called complete. We have seen five waves up from the 2017 low along with significant momentum divergence. Also price has twice put in a weekly close beneath a prior resistance level at 14.17.
Keep in mind that the support targets at 13.33, 12.46 and 11.73 on the weekly chart will probably be most relevant to downward wave (a) — the first part of a downward correction. A corrective pattern could use any of those levels to bounce before attempting to push lower.
United States Oil Fund (USO) – Weekly Chart
The downward trade will probably be choppy as price navigates its way through a correction that could last several months. If the trader manages to get a good entry price, this approach might be ideal for “summer trading” with a scaled-down number of shares/contracts and a bit of patience.
With that in mind, we’re making a special subscription plan available to subscribers who intend to take a lighter trading approach this summer. Take out a year-long subscription to TOTM’s Daily Analysis service (charts every trading day for a wide range of markets), and we’ll deduct the cost of three months of service. Basically you get a whole summer of charts for free! The coupon code to take advantage of this offer is “summer”.
TOTM’s Daily Analysis includes charts every trading day for the S&P 500, crude oil, the Euro and Dollar Index, treasury bonds, and gold.
Twitter: @TradingOnMark
The authors may have a position in the mentioned securities at the time of publication. Any opinions expressed herein are solely those of the author, and do not in any way represent the views or opinions of any other person or entity.

: Cup (and Maybe Handle) Watch")
 Trading Near Top Of Price Range")

