Crude oil prices have made a significant break out of the long-term downward channel in recent months. This has led us to treat last year’s low as a durable low, and we believe a new upward pattern has begun forming in the very big picture.
However even with a long-term bullish outlook, we believe price is ready to put in a downward retrace.
This post shows how the expected downward move in the United States Oil Fund ETF (NYSE Arca: USO) might play out during the remainder of 2018. The current edition of our newsletter includes similar analysis for crude oil futures and also zooms in to look at targets at the scale of a daily chart.
The downward pattern in USO from 2013 counted well as an diagonal wave ‘C’ – the final part of a larger corrective pattern stretching down from the all-time high in 2008. Although we expected price to make a minor new low last year, the pattern can be counted as complete even with the higher (truncated) low that actually manifested.
The first confirmation of a durable low occurred when price broke above the main upper boundary of the downward-sloping channel shown on the weekly chart. The upward breakout along with a potentially completed Elliott wave count into the 2017 low suggest that overall price action after 2017 should be viewed with an overall bullish bias.
The new phase of the pattern could be forming a strong five-wave impulsive move upward, or it could be forming another three-wave corrective segment. However both of those scenarios call for a substantial downward retracement from important resistance nearby.
On the chart, we have shown how price is approaching one of the channel’s upper harmonic lines as well as a zone of Fibonacci resistance levels at 13.47, 13.66, 13.74 and 14.08.
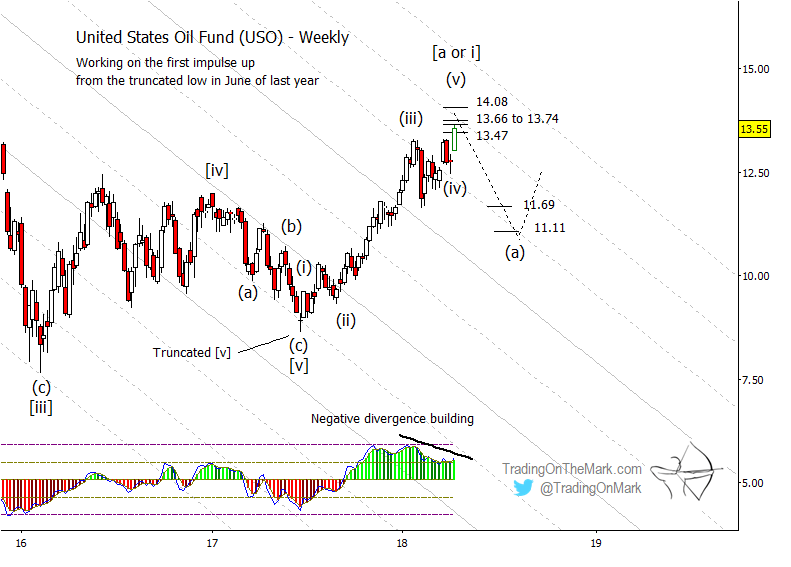
The next downward phase of the pattern should consist of three sub-waves, with the first one labeled as (a) on the chart. Preliminary targets for (a) include 11.69 and 11.11 based on expected Fibonacci measurements from near the current high.
Later this year or early next year, sub-wave (c) of the correction might reach beneath (a), possibly to re-test the broken upper boundary of the channel. However we believe it is unlikely that price will go beneath the 2017 low.
This is the type of charting works on all time frames, from monthly to intraday. Subscribers to TOTM’s services get daily chart updates with this type of analysis for a variety of markets including the S&P 500, crude oil, gold, the Euro, the Dollar, and bond futures. There’s also an option for intraday analysis of the S&P 500.
For the month of April (and starting now), new subscribers can lock in 15% savings permanently on any of our services. You can save even more with a 3-month or 6-month subscription. Check it out here and use the coupon code “Elliott”.
Twitter: @TradingOnMark
No position in any of the mentioned securities at the time of publication. Any opinions expressed herein are solely those of the author, and do not in any way represent the views or opinions of any other person or entity.

: Showing Some Signs of Emerging Strength")
