Crude Oil Chart – Daily
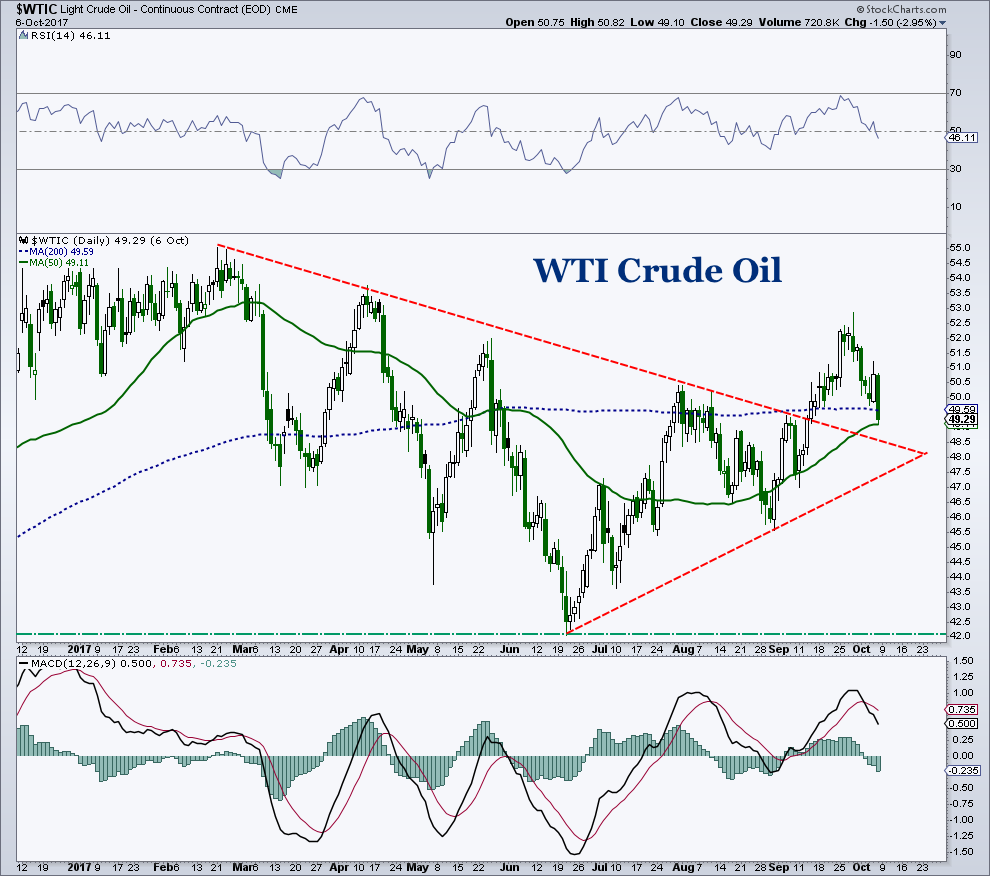
West Texas Crude Oil (WTI) is currently sitting under $50 per barrel.
After bouncing off its 200-day average and chart support near the August highs, crude is at a crossroads… and in danger of rolling over.
If crude oil is going to extend higher, the $49-$50 price area is a logical spot to find support. That’s where the 50-day moving average meets trend line support. But, that area is looking “iffy” here.
As I have shared recently, the only way I would turn bullish is if WTI crude oil is able to make a new recovery high OVER the $55-$56 region and/or the COT data changed dramatically. Note that I wrote about the poor risk/reward for Crude right here last month.
Commercial hedgers (smart money) remain heavily tilted toward the bearish side while large speculators remain very bullish. Generally, not a good combination.
Feel free to reach out to me at arbetermark@gmail.com for inquiries about my newsletter “On The Mark”. Thanks for reading.
Twitter: @MarkArbeter
The author may have positions in related securities at the time of publication. Any opinions expressed herein are solely those of the author, and do not in any way represent the views or opinions of any other person or entity.


 Ready To Break Out?")

