West Texas Crude Oil (WTI) bounced up near $49/$50 last week after holding chart support in the $46 region. But that price area represents strong resistance.
And it is showing today as Crude Oil and related ETFs (NYSEARCA:USO) are falling today.
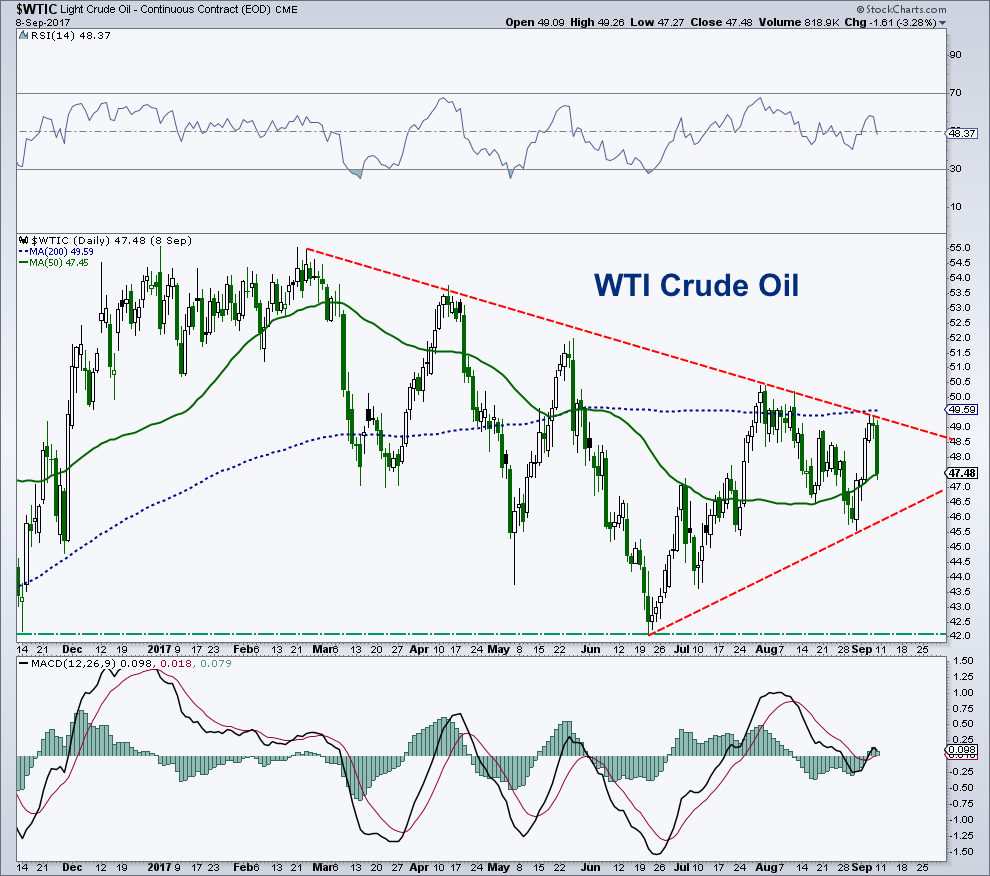
Crude prices remains highly volatile from day to day and week-to-week. Below is an updated chart view. So let’s discuss…
Critical chart support remains at $42, with overhead supply from current prices going all the way up to $55. I still believe WTI has a chance of seeing sub-$40 prices as it appears the commodity is tracing out a very large rounded top that goes all the way back to 2016.
In the COT report, commercial hedgers (smart money) are almost as bearish as they were in June 2014, right before the market cracked big time. Large speculators are almost as bullish as they were back in 2014. Not a favorable combination.
Seasonally, October and November are weak months for crude oil.
WTI Crude Oil Chart Analysis
Feel free to reach out to me at arbetermark@gmail.com for inquiries about my newsletter “On The Mark”. Thanks for reading.
Twitter: @MarkArbeter
The author may have positions in related securities at the time of publication. Any opinions expressed herein are solely those of the author, and do not in any way represent the views or opinions of any other person or entity.
ALSO READ: S&P 500 Outlook Into September


