The following is a recap of The COT Report (Commitment Of Traders) released by the CFTC (Commodity Futures Trading Commission) looking at futures positions of non-commercial holdings as of December 15, 2015. Note that the change in COT report data is week-over-week.
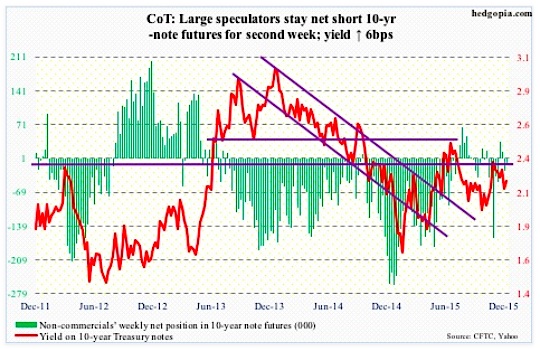
10 Year Treasury Note
Call it ‘dovish’ or ‘hawkish’, the Federal Reserve finally followed through on its first interest rate hike in nine years. The fed funds rate stayed zero-bound for seven long years.
While both through the post-FOMC statement and Chair Janet Yellen’s post-FOMC press conference, the message was that the pace would be gradual, markets and the Fed are on different wavelengths on this.
The dot plot indicates four more rate hikes next year. In the futures market, however, traders currently expect two interest rate hikes in 2016.
From November’s sub-50 ISM manufacturing index to sub-80 capacity utilization to widening credit spreads, economic data argue for a shallow tightening cycle. But it is also a Fed whose tool box is empty, and is in need of adding arrows to its monetary quiver before the next downturn hits.
If the markets let it, that is.
The Ben Bernanke-led Fed sang the virtues of the wealth effect. Ms. Yellen’s Fed is probably no different. Come 2016, if the dot plot continues to maintain the current projected pace, the stock market will probably begin to throw a tantrum, forcing FOMC members to change their tune.
COT Report Data: Currently net short 11.4k, down 13.1k
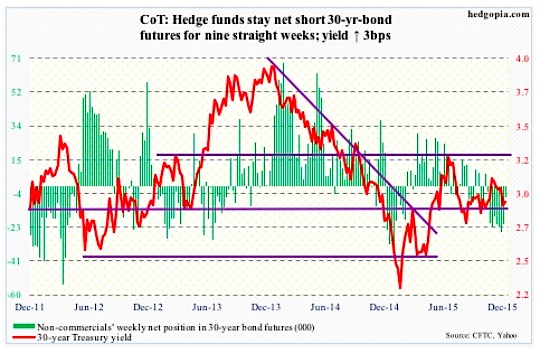
30 Year Treasury Bond
This week’s major economic releases are as follows. Happy Holidays!
On Tuesday, we get GDP (3Q15 final reading), corporate profits (3Q15 revised estimates), as well as existing home sales (November).
The second estimate put GDP growth at 2.1 percent, down from 3.9 percent in the second quarter.
Corporate profits with inventory valuation and capital consumption adjustments for the third quarter came in at a seasonally adjusted rate of $2.06 trillion (preliminary numbers). A year ago, they peaked at $2.16 trillion.
Existing home sales dropped 3.4 percent month-over-month in October to a seasonally adjusted annual rate of 5.36 million units. July sales of 5.58 million were the highest since 5.79 million in February 2007. Likewise, after reaching a nine-year high 112.3 in May, the pending home sales index has dropped to 107.7 in October. The latter tends to lead sales.
Wednesday, we get durable goods orders (advance report for November), personal income (November), new home sales (November), and the University of Michigan’s consumer sentiment (final December reading).
Orders for non-defense capital good ex-aircraft – proxy for business capital expenditures – peaked at $74 billion in September last year, and rose 0.4 percent year-over-year in October, to $70 billion. This was the first y/y increase in nine months.
In the personal income report, all eyes will be fixated on core personal consumption expenditures, which grew at 1.3 percent annually in October. The last time it grew at two percent was in April 2012. Core PCE is the Fed’s favorite inflation gauge.
New home sales jumped 10.7 percent in October after dropping 12.9 percent in September. It is a volatile series. The 12-month rolling average was 495,000 units in October (SAAR) – the highest since 502,000 in November 2008.
The preliminary reading of consumer sentiment was 91.8. January’s 98.1 was the highest since 103.8 in January 2004.
COT Report Data: Currently net short 5.8k, down 15.1k
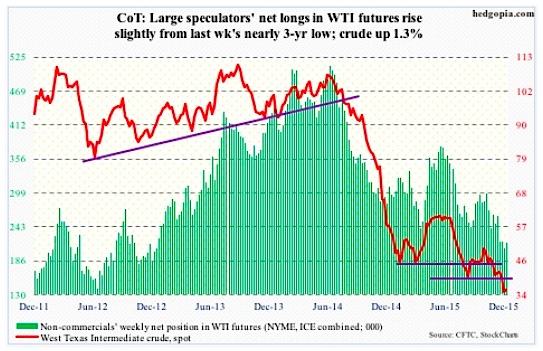
Crude Oil
The EIA report for the week ended December 11th was an out-and-out disappointment.
Crude oil stocks jumped 4.8 million barrels, to 490.7 million barrels – a hair’s breadth away from the all-time high of 490.9 million barrels in the April 24th week.
Gasoline stocks rose by 1.7 million barrels, to 219.4 million barrels – an eight-week high.
Distillate stocks increased 2.6 million barrels, to 152 million barrels – a 13-week high.
Production increased by 12,000 barrels per day, to 9.18 million barrels per day. Oil production peaked at 9.61 mbpd in the June 5th week.
Crude oil imports rose by 291,000 barrels per day, to 8.31 mbpd. This was the highest since 8.36 mbpd in the September 27, 2013 week.
Refinery utilization dropped 1.2 percentage points, to 91.9 percent. This was the second consecutive weekly drop. Utilization peaked at 96.1 percent in the August 7th week.
Spot West Texas Intermediate crude oil dropped below $35 before bouncing, rising 1.3 percent in the week.
OPEC secretary general expects oil output to decline in the next two to three years as this year alone $130 billion in investment is planned to be cut due to low prices; non-OPEC supplies are set to decline by about 400,000 barrels per day next year.
Further, for the first time in 40 years, U.S. crude ban was lifted. That said, the WTI-Brent differential is less than $1/barrel. (Brent dropped 3.9 percent in the week.) In 2011, the spread was nearly $28. Energy Aspects argues that WTI needs to be $4 cheaper for exports to work.
Ah, well!
Per the COT report data, non-commercial traders have been reducing net longs for a while now… last week was at nearly a three-year low.
On a weekly chart, the week produced a doji. Let us see if oil bulls can build on it.
COT Report Data: Currently net long 216.3k, down 9k
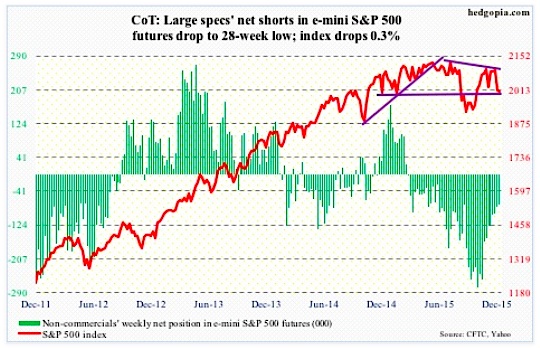
E-mini S&P 500 Index
For the week ended Wednesday, $13.2 billion left U.S.-based equity funds (courtesy of Lipper). This follows withdrawal of $8.6 billion in the prior week.
On September 29th, the S&P 500 index successfully tested August lows, before getting on a powerful rally. Flows, however, failed to cooperate. Secondly, the index has been going sideways/down the past five weeks, and money is beginning to come out, as can be noticed particularly the past couple of weeks. Since September 30th, $11 billion has now left these funds.
In the meantime, foreigners continue to shun U.S. equities. In October, the 12-month running total of net foreign purchases of U.S. equities was minus $84.9 billion. The last time this metric was positive was two years ago.
Bulls have seasonal tailwind at their back, but if flows continue to behave this way, it is only a matter of time before stocks run into a headwind.
From bulls’ perspective, the good thing is that on Monday buyers showed up near 1990 – must-hold support. Resistance at the 50- and 200-day moving averages, which have now converged at 2062, proved too strong for stocks. The 1990 support is once again in play.
Per recent COT report data, non-commercials continue to cut back net shorts – now at a 28-week low.
COT Report Data: Currently net short 75.3k, down 5.5k
continue reading on the next page…


 Ready To Break Out?")