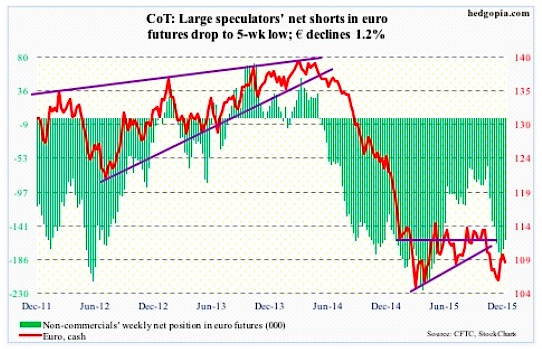
Euro
Markit’s Eurozone manufacturing PMI in December rose to 53.1 – a 20-month high, services fell to 53.9 from 54.2. The composite slipped to 54 from November’s 54.2.
Despite massive depreciation of the euro, growth continues to remain subdued.
Between the May 2014 high and the March 2015 low, the euro collapsed 25 percent. That low was successfully tested last month. The subsequent rally saw it gain nearly five percent in eight sessions, before facing massive resistance at its 200-day moving average. Come Thursday, an intra-day rally attempt got repelled at its 50-day moving average.
The path of least resistance near-term? Probably down.
Non-commercials slightly cut back, but continue to remain heavily net short per recent COT report data.
COT Report Data: Currently net short 160k, down 12.4k
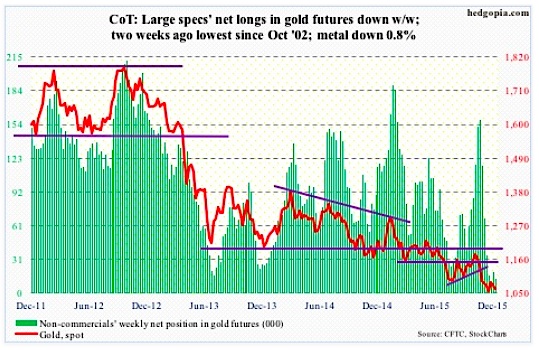
Gold
The interest rate hike this week was one of the most well-telegraphed and well-anticipated Fed moves. The day of the rate hike, spot gold managed to rally 1.1 percent. Come Thursday, it gave it all back and then some – down two percent – thanks to strength in the greenback.
Earlier in the prior several sessions, Gold’s rally attempt stopped at support-turned-resistance at $1,070-$1,080.
Spot Gold remains oversold on a daily basis, and is right underneath the afore-mentioned resistance.
Two weeks ago, non-commercials had the least net longs since October 2002, and have not added much since.
COT Report Data: Currently net long 13.7k, down 6k
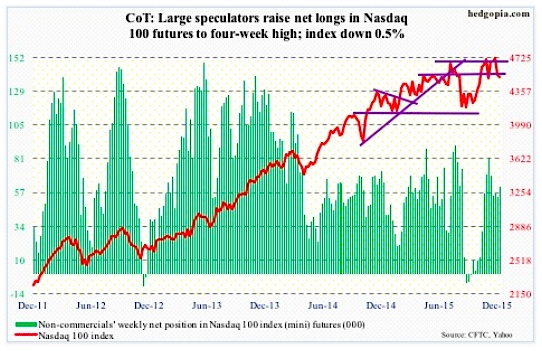
Nasdaq 100 Index (mini)
On Monday, the index found support at its 200-day moving average, followed by a Thursday close right on its 50-day moving average. Friday, it lost that average and tech stocks suffered.
Apple (AAPL), which makes up nearly 13 percent of the index, does not act well. It has broken its June 2013 trend line, and is meeting with resistance at the underside of that broken support. Also, there is potentially a head-and-shoulders pattern forming on a weekly chart, with the neckline break occurring around $105 – worth watching.
Beginning April this year, the 4560 level on this tech stock index has been a line in the sand of sorts. This has once again been lost. The 200-DMA is probably once again in play.
COT Report Data: Currently net long 61.5k, up 7.5k
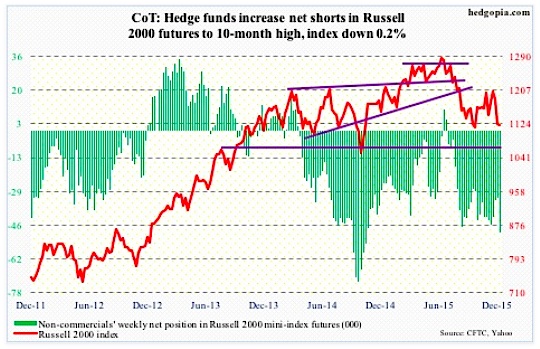
Russell 2000 mini-Index
The 200-day moving average is now pointing lower, with the 50-day flat to slightly lower.
Things would probably look a whole lot different if early this month the index succeeded in taking out the 200-DMA, which at the time also approximated the 1210-1215 resistance in place since March 2014.
It has been a while investors have not fancied small-caps. At this stage in the cycle, it is hard to imagine them putting on their risk-on hat. In this scenario, the medium- to long-term outlook looks bleak.
That said, near-term is another matter. Daily conditions are oversold. Curiously, a reverse head-and-shoulders pattern seems to be developing on a daily chart. The neckline lies at that afore-mentioned 1210-1215 resistance… hard to imagine a breakout for small caps stocks.
As things stand, the best that could happen is unwinding of daily overbought conditions.
That said, non-commercials do not agree, having raised net shorts to a 10-month high.
COT Report Data: Currently net short 49.2k, up 16.7k
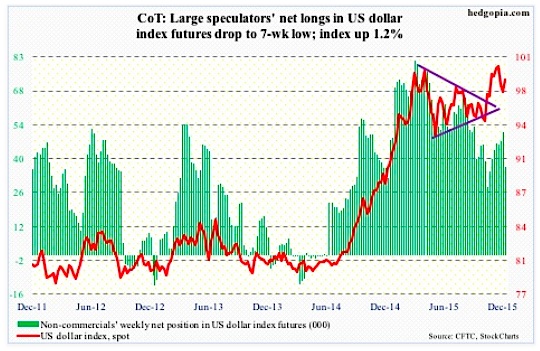
US Dollar Index
Responding to the Bank of Japan’s surprise easing move on Friday morning, the US Dollar Index took a wild ride. Immediately after the BoJ announcement, the greenback rallied, but then the markets decided the unexpected easing did not go far enough, pushing up the yen.
The BoJ left the overall target of annual asset purchases unchanged at around ¥80 trillion, but said it will lengthen the average maturity of the Japanese government bonds it purchases to seven to 12 years from seven to 10 years. Plus, it will buy another ¥300 billion of exchange-traded equity funds, which will be in addition to the ¥3 trillion in ETFs it has purchased annually since late 2014. Desperate!
Despite the reaction post-BoJ decision, the dollar index can go either way near-term. Medium- to long-term, for it to break out of March and November (this year) highs, the fed funds rate probably needs to go up at least a point next year – not likely.
Interestingly, in a week in which the Fed was all but certain to raise rates, non-commercials reduced net longs by 28 percent per COT report data.
COT Report Data: Currently net long 36.9k, down 14.1k
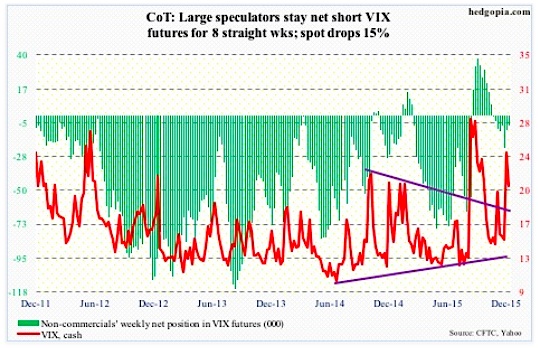
VIX Volatility Index
Last week, spot VIX surged past 50- and 200-day moving averages as well as horizontal resistance at 16 and 21-22. Come Monday, it spiked another 10 percent, before reversing.
More often than not, a spike reversal is followed by continued pressure on the spot. That was the case until Thursday when volatility buyers stepped up to defend 16.
The spot VIX has once again reclaimed the afore-mentioned averages.
That said, VIX is not done unwinding daily overbought conditions. Friday, it was not able to hold on to gains, even as stocks in general closed near session lows.
In the meantime, the VIX to VXV ratio, at 0.97, is beginning to drop from overbought zone. Last Friday, the VIX to VXV ratio spiked to unity.
The probable path of least resistance near-term? Down.
COT Report Data: Currently net short 7.4k, down 2.7k
Thanks for reading.
Twitter: @hedgopia
Read more from Paban on his blog.
The author does not have a position in any of the mentioned securities at the time of publication. Any opinions expressed herein are solely those of the author, and do not in any way represent the views or opinions of any other person or entity.


: Showing Some Signs of Emerging Strength")
