After the first rate hike in 9 years, the Federal Reserve and the financial markets are locking horns.
The Fed finally followed through on their first rate hike. The long-awaited liftoff is here. On Wednesday, the target range for the fed funds rate was raised to 0.25 percent to 0.5 percent – from the previous range of zero to 0.25 percent. This is the first interest rate hike since 2006; interest rates stayed zero-bound for seven years.
Either way you cut it, the move is historic. More so considering the Federal Reserve made the move in the face of data points that in the past have not coincided with the beginning of an interest rate tightening cycle.
This is not any other cycle. Thanks to seven years of ZIRP (zero interest rate policy), there is mispricing of assets, price discovering is missing. Signs of excesses abound.
The Fed moved alright, but the pace would be gradual and data-dependent – a point driven home by both the FOMC statement and Janet Yellen, the Fed chair, in her post-FOMC press conference.
In light of this, the following three charts are worth a close look – they lend us some insight into the corner the Federal Reserve has painted itself into… and how aggressive the Fed may or may not get come next year.
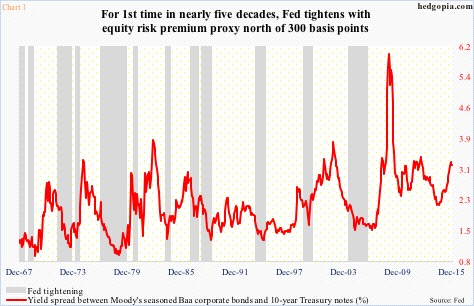
Chart 1 below plots the yield spread between Moody’s Baa corporate bonds and 10-year Treasury notes with 12 tightening cycles going back to 1967. Currently, the spread is north of 300 basis points, and has been that way since August. Prior to Wednesday, the Fed has never tightened with the red line as wide as it is. So the rate hike this week is setting precedent of sorts.
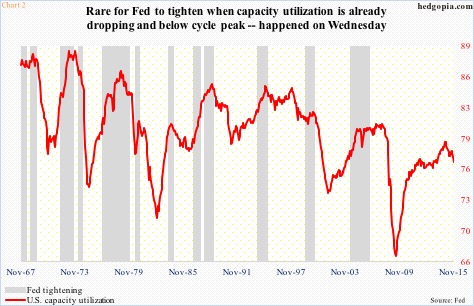
Capacity utilization in November dropped 0.7 percent month-over-month, to 76.95 percent. Year-over-year, it fell 2.6 percent – its seventh straight monthly decline. In the current cycle, utilization peaked at 79.04 percent a year ago, and has weakened since.
Once again, going back nearly five decades, it is not often the Fed begins to tighten when utilization is dropping from a cycle peak. In Chart 2 (below), this took place in 1974, 1980 and 1999, with each of these years with its own unique characteristics. As relates to both 1974 and 1980, tightening had begun much earlier – 1972 and 1976, respectively. Inflation was a big problem back then, and Paul Volker was on the case. And 1999… well, the less said the better.
In each of the cases above, utilization was higher than what we have now – March 1974 (86.7 percent), August 1980 (77.9 percent), and June 1999 (81.3 percent).
On Wednesday, the Fed moved anyway.
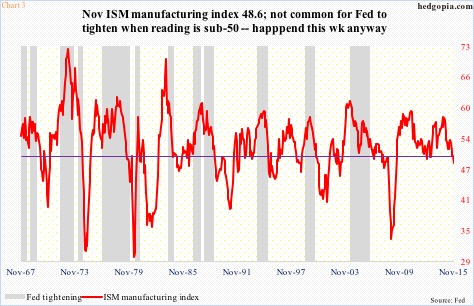
Lastly, the ISM manufacturing index dipped into contraction mode in November (see Chart 3 below). The 48.6 reading was the first sub-50 reading in three years. In nearly five decades now, only once has the Fed tightened when manufacturing was contracting. That was August 1980, with different sets of circumstances. Mr. Volcker was trying to stomp out inflation. The tightening campaign had begun much earlier, with the fed funds rate rising 50 basis points to 10 percent in August 1980. Nothing like a rate hike today, with rates near zero.
One look at the charts above, and it is easy to see why markets currently expect a shallow tightening cycle next year. In the futures market, traders currently expect two more hikes in 2016.
continue reading on the next page…


: Showing Some Signs of Emerging Strength")
