September Corn Futures closed down 19 cents per bushel last week (week on week), finishing at #3.41.
Corn Bulls are feeling the heat here… time to keep an eye on soybeans.
Let’s discuss and review key themes and trends. Note my trading outlook further below.
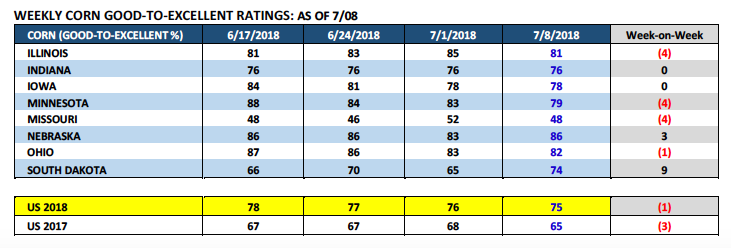
Monday’s Weekly Crop Progress report showed the U.S. corn good-to-excellent rating falling 1% week-on-week.
This was essentially what the market was expecting. The U.S. corn good-to-excellent rating was estimated at 75% versus 65% a year ago. That said over the last four weeks Iowa’s good-to-excellent rating has fallen 6% to 78%. Minnesota’s rating has decreased 9% to 79%.
Obviously both those ratings figures are still remarkably high for early July; however it is worth nothing that the trend in ratings has indeed turned lower as the crop has matured. Crop surveyors have been more able to recognize and assess the field variability in sections of both states due to excess rains during the month of June.
In addition I do know from first-hand accounts that there are areas of Minnesota in particular where corn yields are likely to be off 10 to 15% versus a year ago. How big are those areas? That’s difficult to assess regarding whether they’re large enough to materially affect MN’s state average corn yield. I am of the opinion however that current Weekly Crop Condition reports have been slow to react to any potentially negative yield data this year.
Why? In 2017 those same Crop Condition reports came under fire due to ratings reflecting a U.S. corn yield at or slightly below trend for much of the growing season only to then learn post-harvest the U.S. would produce a record-setting corn yield in 2017/18 of 176.6 bpa. They have no desire to be made a fool two years in a row.
On Thursday the USDA released its July 2018 WASDE report. In that report the USDA actually offered what should be some much needed fundamental price support for corn futures. 2018/19 U.S. corn ending stocks decreased 25 million bushels month-on-month to 1.552 billion bushels versus the average trade guess of 1.712 billion. Therefore even with U.S. corn planted acreage going up 1.1 million acres in the July report (which the market knew in advance via the June 29thAcreage report), U.S. corn ending stocks still went down. That was a huge surprise. The acreage increase was completely offset by lower carryin stocks, as well as, total U.S. corn demand increasing 140 million bushels vs June.
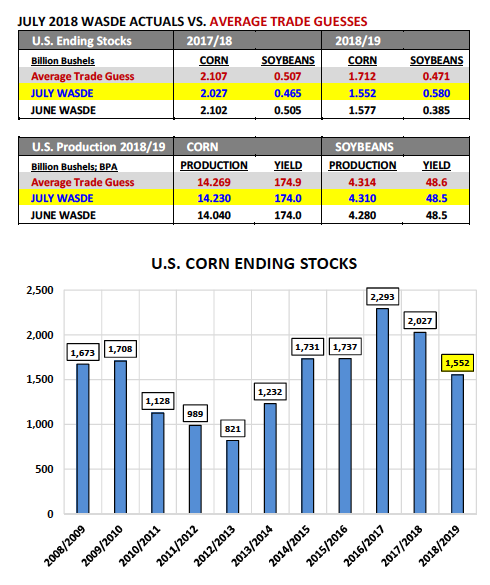
What was the immediate market reaction? Corn futures did rally; however not as aggressively as they probably should have given the fact that September corn futures were already trading at a 35 to 45-cents per bushel discount to a year ago as of July 11th/12th. Furthermore in the July 2017 WASDE report 2017/18 U.S. corn ending stocks were estimated at 2.325 billion bushels, 773 million bushels HIGHER than the USDA’s 2018/19 forecast this Thursday. Something’s not exactly measuring up…
Corn Bears will argue the USDA will have to raise the U.S. corn yield in the August WASDE report (which was left unchanged at 174 bpa) to account for current excellent crop condition ratings. However…even a 3 bpa improvement still only increases U.S. corn ending stocks to 1.801 billion bushels, which remains approximately 360 million bushels below the prior to 2-year average.
I continue to believe that minus the U.S. versus China trade war (which pushed 2018/19 U.S. soybean ending stocks up to 580 million bushel bushels in the July WASDE report via U.S soybean exports being slashed 250 million bushels), corn futures would be 35 to 45-cents per bushel higher versus present values. Regardless with 2018/19 World Corn Stocks dropping to 151.96 MMT in the July report, which is down 33% from 2016/17, I’m not sure how long Money Managers will continue pressuring this market to the downside with CU18 trading at approximately $3.40 per bushel.
SEPTEMBER CORN FUTURES TRADING OUTLOOK
The corn market continued to drift lower this week with September corn futures trading down to a day low and new contract low of $3.37 ¼ on Thursday, 7/12. By comparison on July 12th, 2017 September corn futures traded down to day low of $3.84 ½, closing at $3.85 ½ that afternoon. As I mentioned previously in the July 2017 WASDE report, 2017/18 U.S. corn ending stocks were estimated at 2.325 billion bushels.
In Thursday’s July 2018 WASDE report, 2018/19 U.S. corn ending stocks were forecasted at 1.552 billion bushels, 773 million bushels below the previous July and yet Sep corn futures continue to trade at approximately a 35 to 45-cents per bushel discount relative to the same period a year ago. Furthermore last year September corn futures actually rallied back up to a day high of $3.93 ¼ on July 20th, 2017…EVEN with the USDA’s +2.3 billion bushel carryout projection still being digested by the market.
How then do we make sense of the price disparity and can we find any tangible evidence to suggest corn is close to carving out a bottom? I continue to chalk most of the price weakness under $3.70 to $3.80 in September corn futures up to the U.S. v China trade dispute and its impact on soybean futures. Last year August soybean futures were trading between $9.72 ¼ and $10.32 ½ during the 7/10 – 7/14 timeframe.
On Friday, 7/13/18, August soybean futures traded down to a day low $8.11 ¾…the lowest soybean futures have traded since December 2008. Invariably that price pressure was going to spill over into the corn market and it has.
Therefore whether or not corn futures are done going down will have a lot to do with soybean futures stabilizing. There is no futures playbook for trade wars. That said…what I do know is minus the tariffs, corn futures are undervalued in my opinion relative to the current U.S. and World corn balance sheets.
Twitter: @MarcusLudtke
Author hedges corn futures and may have a position at the time of publication. Any opinions expressed herein are solely those of the author, and do not in any way represent the views or opinions of any other person or entity.
Data References:
- USDA United States Department of Ag
- EIA Energy Information Association
- NASS National Agricultural Statistics Service

: Worrisome to Broader Market?")

