
Amazon Stock (AMZN) Testing Important 2025 Support
Amazon's stock price has been mired in a sideways to lower consolidation since late July.
This consolidation could be bullish, however, if bulls step up...
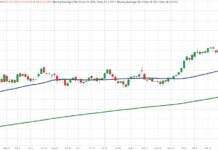
Did Gold and Silver Reach A Trading Top?
I read today that a lot of the future of higher gold prices rests on whether China can seduce other nations to store gold...
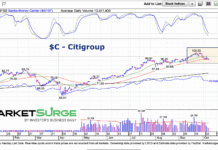
Citigroup Stock Testing 50-Day Moving Average As Earnings Near
Stocks remain elevated as 3rd quarter earnings season is about to kick off.
This includes most mega cap bank stocks.
Today we look at Citigroup (C)...

Retail Sector ETF (XRT) Fails 50-Day Moving Average —Pay Attention
Retail Stumbles Below Support
The Retail Sector ETF (NYSEARCA: XRT) just lost its grip on the 50-day moving average, a key short-term support level that...
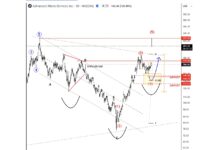
AMD Stock Jumps After OpenAI Deal, But Rally In Late Stages
Advanced Micro Devices (NASDAQ: AMD) has seen more than a 30% gap higher after announcing an agreement with OpenAI.
Back on September 09, we highlighted an...
The Inflation Trifecta: Fiat Currency, Precious Metals, and Fuel
The trifecta of inflation” usually refers to the three core drivers that push inflation higher at the same time, creating a stronger and often...

Utilities Sector Eyeing Major Price Breakout
The stock market has delivered big gains thus far this year.
But stocks aren't the only winners. Gold, Silver, and Bitcoin are also among...
Why Investors Should Watch For Stock Market Volatility
Last week I wrote a market update speculating on whether the Russell 2000 (IWM) had put in a technical pattern called triple tops, or...
How Much of a Stock Correction Should Investors Expect?
Last week I wrote a market update that speculated on whether Russell 2000 ETF (NYSEARCA: IWM) had put in a technical pattern called triple...
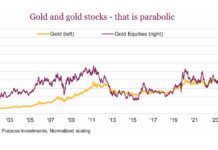
Gold Market Analysis: Bull(ion)s vs Bears
The TSX (Canadian stock index) is now up 22% so far in 2025, one of the leading markets globally. And much of this performance...