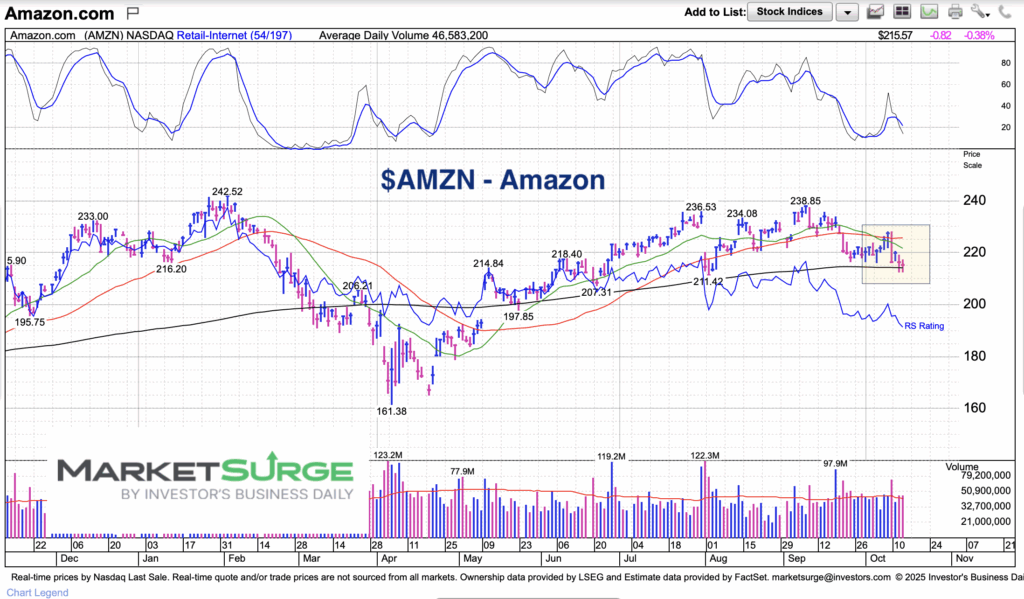
Amazon’s stock price has been mired in a sideways to lower consolidation since late July.
This consolidation could be bullish, however, if bulls step up right here.
Amazon (AMZN) is testing its 50-day moving average for the second time (last time was August low).
If it holds, it could mean another move back toward the 2025 highs.
Note that the following MarketSurge charts are built with Investors Business Daily’s product suite.
I am an Investors Business Daily (IBD) partner and promote the use of their products. The entire platform offers a good mix of tools, education, and technical and fundamental data.
$AMZN Amazon Stock Chart
Looking at the chart, you can see that AMZN is trading at the lower edge of its 4 month trading range. Let’s watch to see if this dual support (combined with 50-day moving average) holds. Stay tuned.
Twitter: @andrewnyquist
The author may have a position in mentioned securities at the time of publication. Any opinions expressed herein are solely those of the author, and do not in any way represent the views or opinions of any other person or entity.


