Retail Stumbles Below Support
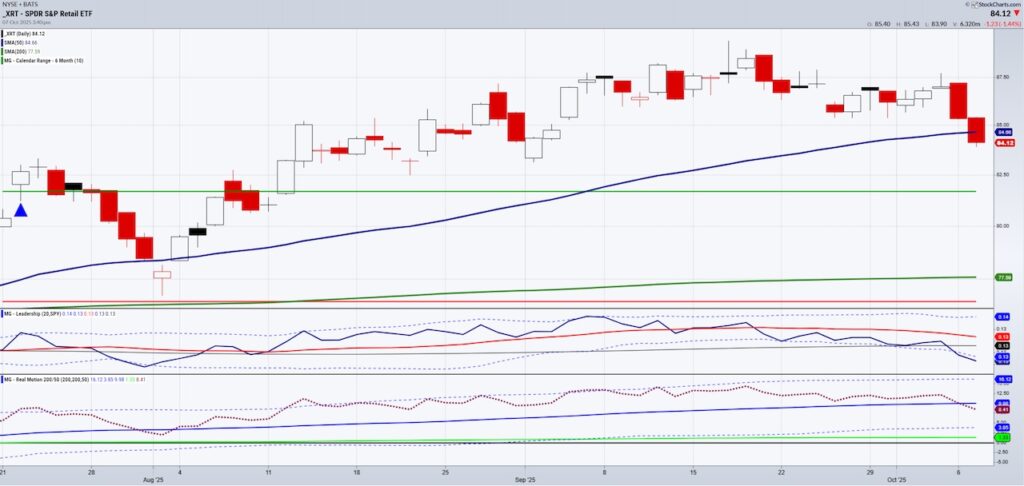
The Retail Sector ETF (NYSEARCA: XRT) just lost its grip on the 50-day moving average, a key short-term support level that often marks the line between healthy pullbacks and trend reversals.
This isn’t just a technical trip — it’s a sentiment signal that the American consumer, long the backbone of this market, may be running low on gas.
- The Retail Sector ETF (XRT) closed decisively below its 50-DMA after multiple failed attempts to hold above it in late September.
- Momentum indicators such as RSI have rolled over, confirming fading buying pressure.
- Volume has been heavier on down days, a classic distribution pattern suggesting institutional selling.
If XRT can’t recover quickly, we could be looking at a phase shift from Bullish to Caution, and possibly even to Distribution.
WHY IT MATTERS FOR INVESTORS
Retail sits at the center of the Economic Modern Family — the pulse of the consumer and, by extension, the broader economy.
When the Retail sector weakens, it often precedes broader market fatigue.
- Consumer resilience is under pressure. Rising living costs, student loan repayments, and mounting credit card delinquencies are taking a toll.
- Equal-weight construction reveals the real story. Unlike the cap-weighted giants, XRT shows how average retailers are struggling.
- Breadth deterioration. A weak XRT often foreshadows softness in small caps (IWM) and transports (IYT).
Investors should pay attention because consumer spending drives 70% of U.S. GDP — when Granny sneezes, the market catches a cold.
Furthermore, KRE of the Regional Banks sector, already showed us signs of weakness with only a shallow bounce following news of Fifth Third Bank’s acquisition of Comerica Bank.
KRE has to hold around 63.00
The timing of this failure is crucial. The Fed remains caught between easing inflation and sustaining growth. Retail softness may be the first crack in the “soft landing” narrative.
- Oil prices are rebounding, threatening to keep inflation sticky.
- Wage growth has stalled, especially for lower earners.
- Credit conditions remain tight, limiting spending power.
If Retail stocks continue to weaken, the Fed’s path to rate cuts could narrow — not because inflation is roaring back, but because growth is rolling over.
TECHNICAL WATCHLIST
| Key Level | Signal | Implication |
| $83.11 | Must hold | A break confirms a warning phase and a break of the September low |
| 50-DMA Recovery | Two consecutive closes above | Restores bullish bias |
| XRT vs. SPY Ratio | Falling | Sign of defensive rotation |
Keep an eye on COST, TGT, WMT, and AMZN — leadership in these names will determine whether the consumer narrative stabilizes or cracks further.
Also watch IWM (Small Caps) for confirmation; if both fail simultaneously, the risk-on trade could unwind quickly.
TAKEAWAY
Retail’s stumble below the 50-DMA isn’t just another chart event — it’s a warning flag.
Retail stocks often lead turns in both directions.
If the consumer is finally feeling the strain, the next few weeks could tell us whether this market still has the spending power to sustain the rally — or whether the Family matriarch just signaled it’s time to take some profits.
Twitter: @marketminute
The author may have a position in mentioned securities at the time of publication. Any opinions expressed herein are solely those of the author and do not represent the views or opinions of any other person or entity.


