
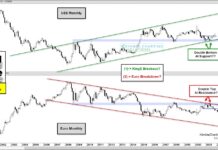
Currency Markets Roiled As US Dollar Strengthens
The currency markets are among the largest in the world. And when the reserve currency U.S. Dollar makes a big move, other assets listen...
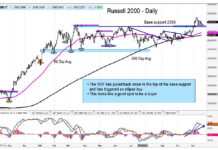
U.S. Equities Bullish Pullback Is Setup For New Highs
We got the pullback we were looking for in the major averages last week.
We'll see if last week's lows hold... if not, the pullback...
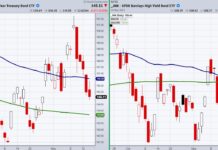
Did the Long-Term Treasury Bonds (TLT) Turn Risk On?
On Tuesday, the Long-Term Treasury Bonds ETF (TLT) closed underneath its 50-Day moving average for the second consecutive day confirming a cautionary phase.
TLTs trend...
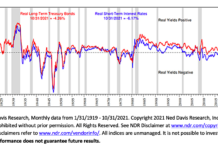
What If Inflation Is Here To Stay?
While consumers continue to face sticker shock when filling up their gas tanks, buying groceries or even paying rent, the debate among economists and...
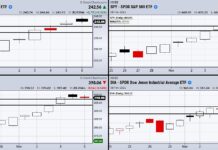
Is The Stock Market Looking to Consolidate Near Highs?
Inflation pressures take the medias focus this week.
Nevertheless, we must remember the news does not always align with market price.
With that said, prices are...
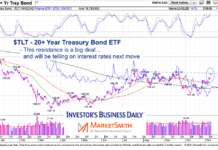
Next Move In Treasury Bonds / Interest Rates Is Here
Long-dated U.S. treasury bonds have moved higher recently but the trend remains down.
The rally has brought the 20+ Year US Treasury Bond ETF (TLT)...
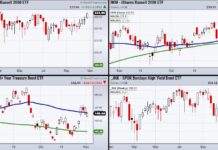
Why Investors Should Watch Junk Bonds (JNK) This Week
This Tuesday and Wednesday the Federal Reserve policy meeting will be held. Investors are expecting to hear a tapering announcement involving the monthly bond-buying program.
This...

Market Outlook Remains Bullish As Stock Indices Flex Muscle
The S&P 500 Index rallied for the fifth straight session on Tuesday, pushing higher by 0.74%. The index is less than 1% away from...
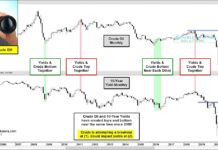
Will Crude Oil Price Breakout Signal Rising Interest Rates?
When crude oil prices rise, investors typically think of an improving global economy.
But when crude oil price rise sharply (by a large amount over...
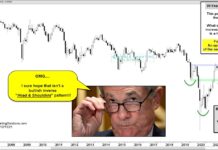
Is A Bullish Pattern Developing For U.S. Treasury Bond Yields?!?
As you might imagine, US Treasury Bond Yields (and interest rates) crashed following the news of the coronavirus in 2020.
But it didn't take long...