As you might imagine, US Treasury Bond Yields (and interest rates) crashed following the news of the coronavirus in 2020.
But it didn’t take long for them to make a sharp U-turn and head higher.
This seems to fit with the major concern of the day: inflation. Which then leads to generally higher interest rates.
Today, we take a look at the long-term “monthly” chart of the 30-Year US Treasury Bond yield to illustrate a developing concern.
Are Interest Rates About To Explode Higher?
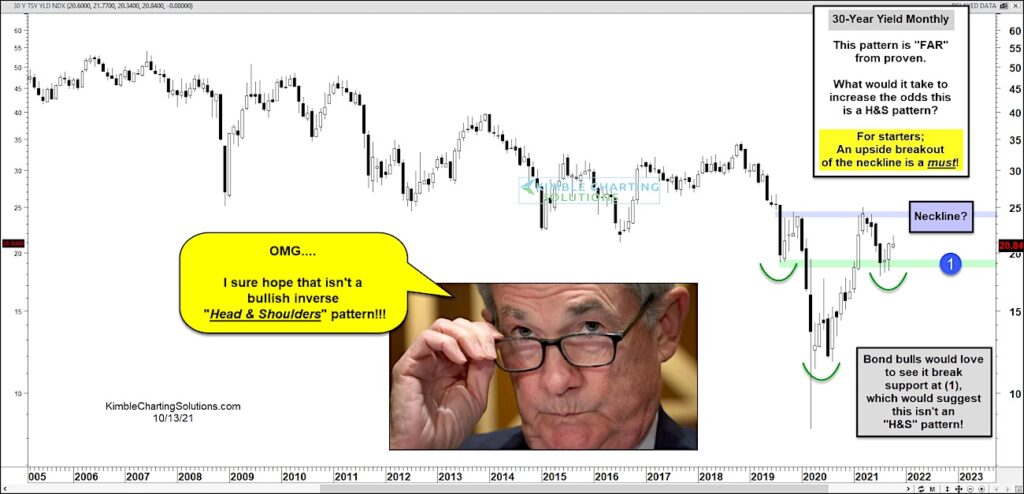
The 30-Year bond yield appears to be forming a bullish inverse head and shoulders pattern. Now this pattern is far from proven. We would still need to see the rest of the right shoulder form, along with a breakout over the neckline.
If this pattern comes true, it would have major consequences for the US economy, financial markets, and Federal Reserve (they are trying to keep rates low). Fed chairman Powell certainly hopes this isn’t a bullish H&S pattern! Stay tuned!
30-Year US Treasury Bond Yield “monthly” Chart
Note that KimbleCharting is offering a 2 week Free trial to See It Market readers. Just send me an email to services@kimblechartingsolutions.com for details to get set up.
Twitter: @KimbleCharting
Any opinions expressed herein are solely those of the author, and do not in any way represent the views or opinions of any other person or entity.
October 13, 2021 3:10pm CST: Editor corrected misspelled word (changed “share” to “sharp”).

 Rolling Over At Key Fibonacci Level?")


