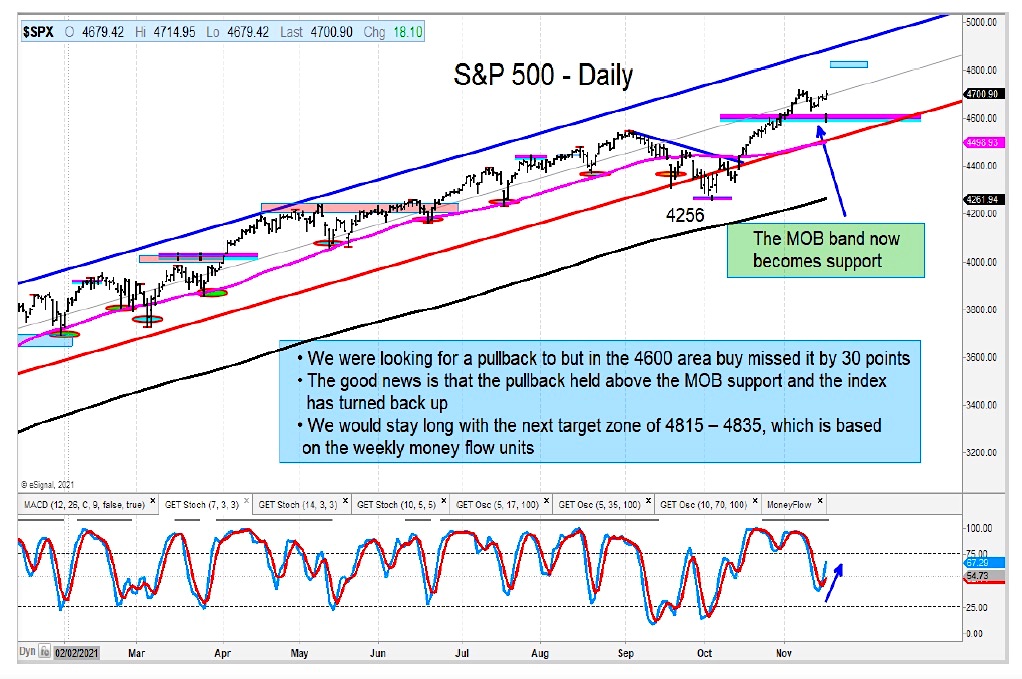
We got the pullback we were looking for in the major averages last week.
We’ll see if last week’s lows hold… if not, the pullback will extend a bit longer. By all means, it looks bullish.
We also cover the red-hot US Dollar Index and discuss what may be next for the greenback. Below are some brief insights with a few trading charts.
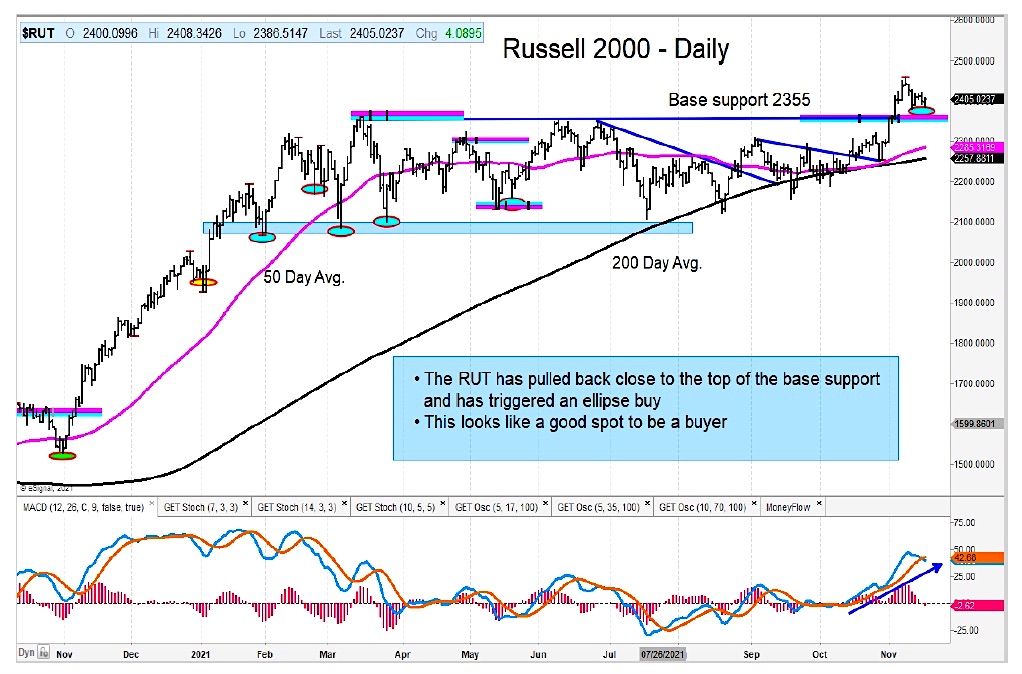
The Russell 2000 jumps out as a bullish pullback to the top of base support. And the S&P 500 Index is holding up well and has a higher price target (4815-4835).
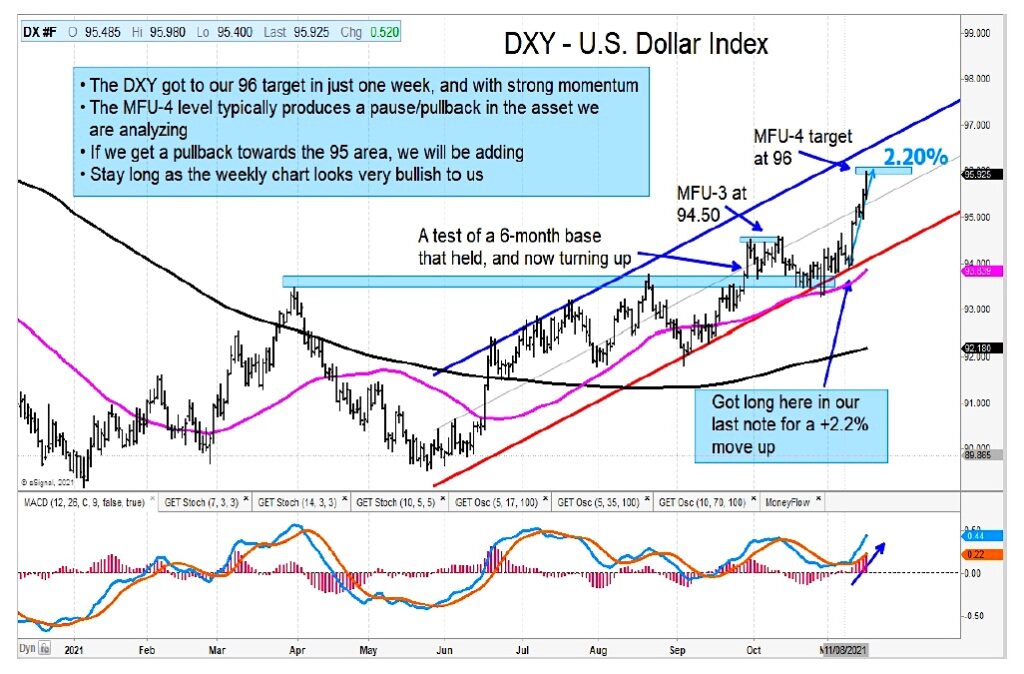
The US Dollar Index (DXY) turned up on a dime last week at channel support. The MFU-4 target was achieved this week with price coming into the 96 level. This is a zone where we would be looking for a pause/pullback for the US Dollar. Within the context of the long-term picture, we note that the US Dollar Index has cleared major resistance, and the weekly Money Flow Unit target comes in at 99.
The 10-year US treasury bond yield chart has a bullish setup with upside to the 1.85—1.93 area.
The author or his firm have a position in mentioned securities at the time of publication. Any opinions expressed herein are solely those of the author, and do not in any way represent the views or opinions of any other person or entity.

: Cup (and Maybe Handle) Watch")
 Trading Near Top Of Price Range")

