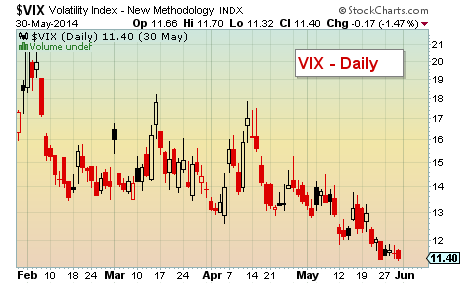
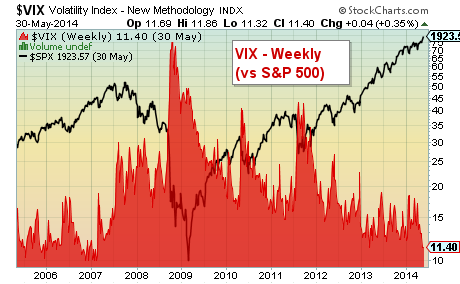
 The first few weeks of May were choppy, but didn’t give way to the “Sell In May” seasonality. In fact, the last week was very strong, propelling the S&P 500 to new highs. That said, the S&P 500 is up a hard earned (and leading) 4 percent on the year, and glaring divergences continue to be the buzz on the street. With the Volatility Index (VIX) nearing a 10 handle, perhaps June will get bumpy.
Our research during the May included (to name a few) Robert Lesnicki’s popular monthly seasonality post on strong and week trending stocks, Andrew Thrasher’s post on market divergences, Andrew Kassen’s always insightful research into the lack of volatility in the markets (here and here), and my post on why it’s best to wait for confirmation. Oh, and we covered the S&P 500 breakout into month’s end, highlighting where it may be headed.
A solid quote from Andrew Kassen sums up what may be on the horizon, in terms of volatility:
The inevitable increase in volatility in FX, rates and equities doesn’t have to equal a breakdown of this trend or even a pause in its progression; to wit, more volatility is exactly what incited this wave of encroachment by central banks into financial markets and any renewed stress on “the system” will only be met with further consolidation. But whatever that stress ultimately looks like, it will have to return in some form to incite the uptick in volatility that – working from the safe assumption this time still isn’t different – is soon in coming.
 Simply put, the market is still in flux. The S&P 500 is at all-time highs, while many momo names, small caps, and tech stocks are not. And while the trend is still pushing higher, it’s a market that lends itself to being picky and precise. And ready.
One chart that continues to garner attention is the Volatility Index (VIX). The charts to the right highlight how far the VIX has fallen. While this may be in line with a more normalized historical reading, it is the indexes first foray this low in 7 years, so some reaction is likely. Another reason traders should be focused in June.
 Okay, time to reflect on the best blogs for the month of May in the latest installment of The Best of See It Market. As always, thank you for your readership.
THE BEST OF SEE IT MARKET – May 2014
INVESTING RESEARCH
Which Stocks Are Driving The S&P 500’s Large Cap Outperformance by Andrew Kassen
Awaiting Confirmation: ‘Less Is More’ In Messy Market by Andrew Nyquist
The Case For Using Investment Leverage by Raj Dhaliwal
Stock Market Hits New Highs, But Lack Of Confirmation Concerning by Andrew Thrasher
The Development Of A Belief System by David Blair
Mapping The S&P 500: Fibonacci Price Targets and Timing Considerations by Andrew Nyquist
The Global Reach Of The Volatility Crash by Andrew Kassen
May Seasonality: Strong and Weak Trending Stocks by Robert Lesnicki
Income Investors: Is It Time To Trade In Your Aggregate Bond ETFs? by David Fabian
Could Financial Warfare Waged Abroad Boomerang on U.S.? by Jeff Voudrie
Rising Meat Prices Point To Expensive BBQ Season by Korey Bauer
CHARTOLOGY
Market SnapShot: Major Indices Nearing Big Levels by Andrew Nyquist
Wheat Futures Lower On Harmonic Pattern Sell Signal by Alex Bernal
Did SPY’s Close Over It’s Upper Bollinger Band Just Give A Short Signal? by Andrew Kassen
Celgene (CELG) At Technical Crossroads by Maria Rinehart
Look for another installment of “The Best of See It Market” next month.
Twitter: @andrewnyquist and @seeitmarket


