 When doing technical research, we all have some version of a “holy grail” trading setup in our minds. For me, that setup came together last week with Wheat futures.
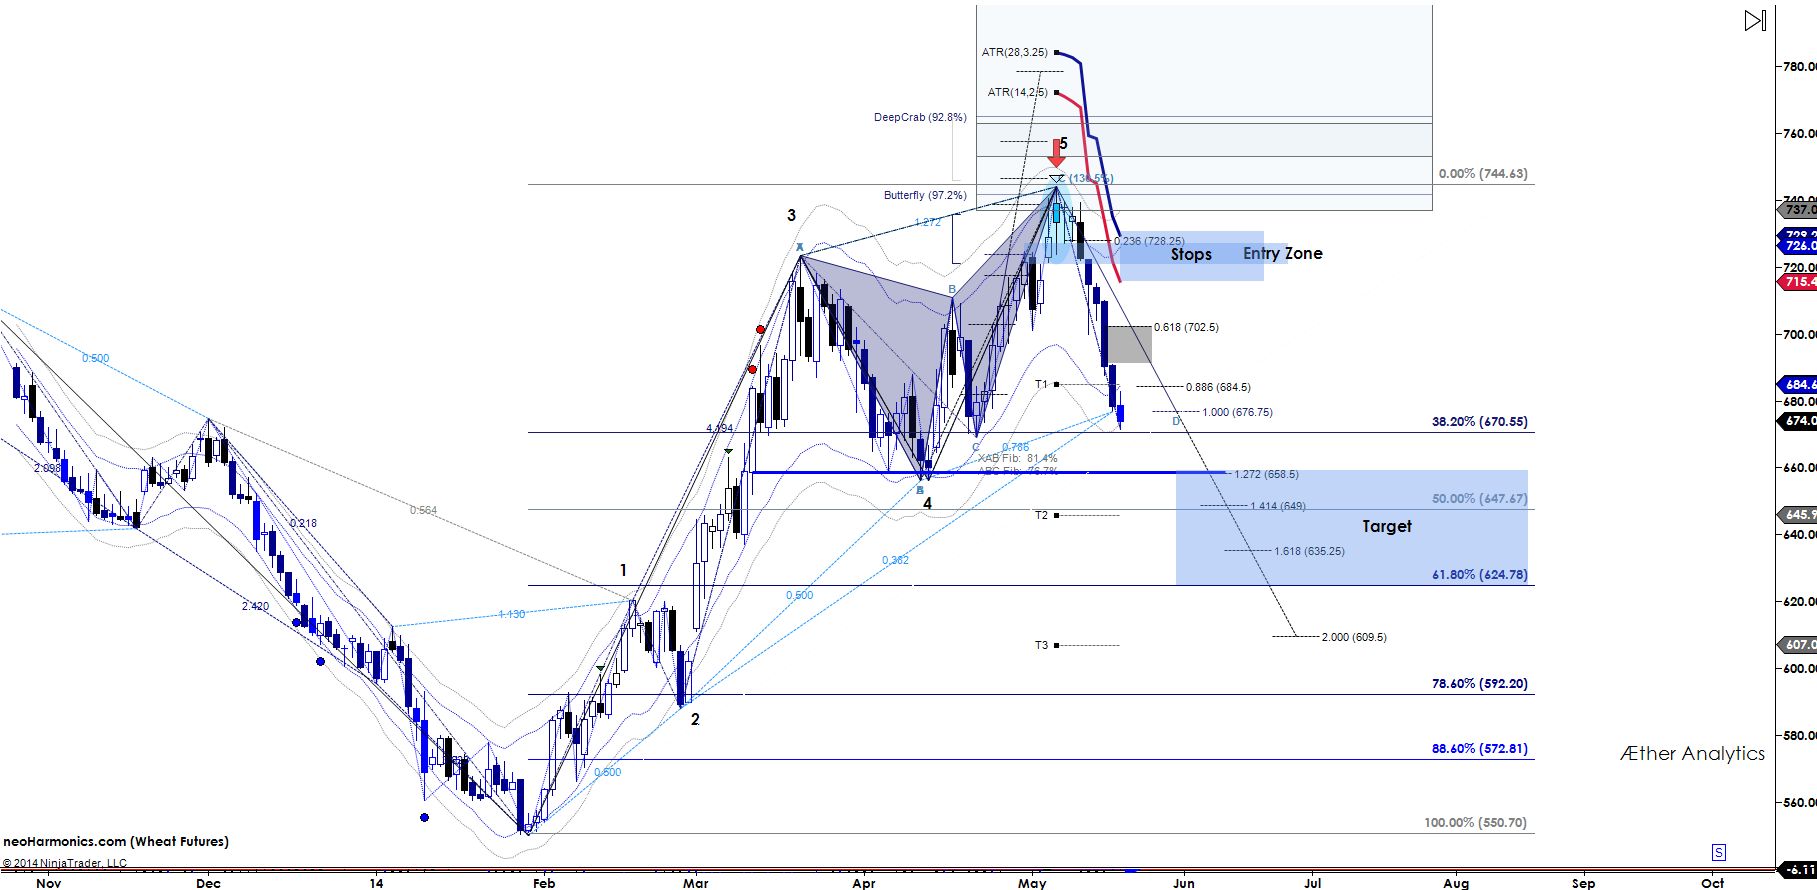
Below is a chart highlighting the harmonic price pattern in Wheat futures. This setup produced a short-term top last week that is seeing follow through declines this week.
The specs of this pattern are as follows:
- Very Clear and Symetrical 5 wave complete elliott wave pattern that precedes harmonic setup
- High ranking symettry harmonic pattern (price and time) between wave 3 and 5.
- Momentum divergences between wave 3 and 5 swings
- Decreasing volume in wave 5 in comparison to wave 3
Harmonic Pattern In Wheat Futures Chart
Author holds no positions in securities mentioned at the time of publication. Any opinions expressed herein are solely those of the author, and do not in any way represent the views or opinions of any other person or entity.

 Testing Important Price Support")
: Cup (and Maybe Handle) Watch")

