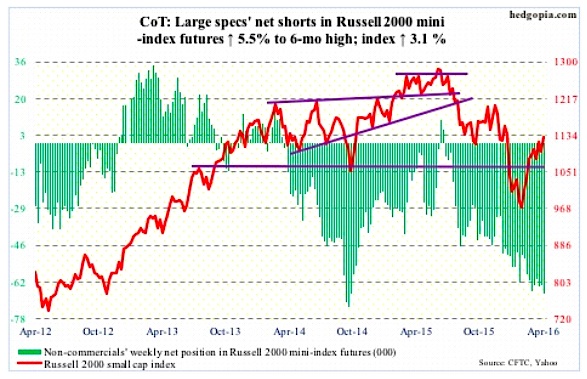
Russell 2000 mini-index: By Thursday, the Russell 2000 was up 2.9 percent for the week, and had just tagged its 200-day moving average as well as the upper Bollinger Band. The session produced a doji.
The Thursday as well as Friday highs also kissed a declining trend line from last June. A breakout here would be major development for stocks, and would be quite a feat given the amount of flows out of IWM, the iShares Russell 2000 ETF.
In the week ended Wednesday, $136 million was withdrawn from the ETF (courtesy of Lipper). Last week, $890 million left.
Non-commercials continue to stay put with their bearish bias even though they have been wrong since February 11th.
April 15 COT Report Data: Currently net short 66.9k, up 3.5k.
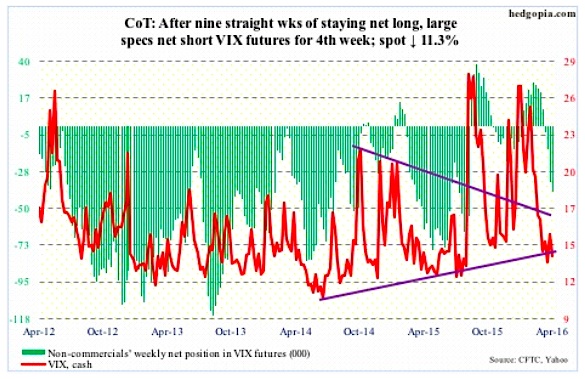
VIX: After it was rejected by the upper Bollinger Band on Tuesday, spot VIX went on to lose north of three points in three sessions, closing below 14 on Wednesday through Friday. The bands are narrowing. A sharp move is probably round the corner. Given VIX is in the low teens and remains oversold, the probable path of least resistance is up.
The VIX-to-VXV ratio once again dipped below 0.8. Four weeks ago, the ratio dropped to 0.782 – a one-year low. This, too, is signaling an impending move higher in spot VIX.
April 15 COT Report Data: Currently net short 40.3k, up 6k.
CURRENCIES
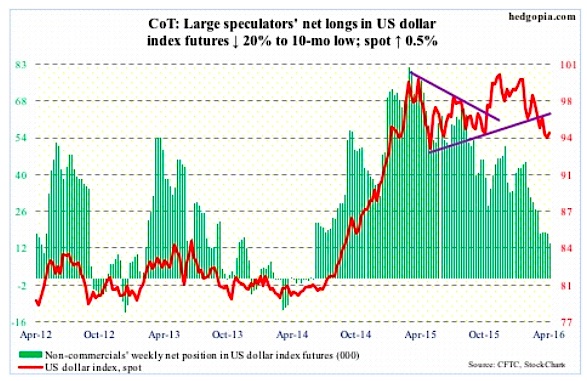
US Dollar Index: Prior to Wednesday’s 0.9-percent jump, the US Dollar index produced several doji sessions. A sign of fatigue – fatigue of going down.
Then on Tuesday, Japan’s finance minister warned against excessive yen strength – perhaps more fodder for strength in the dollar index.
On a daily basis, the US Dollar just had a bullish MACD crossover.
Overhead resistance is strong – particularly around 97, which is where the 200-day moving average lies as well (97.05). The 50-day moving average (96.09) continues to drop.
The next thing to watch is if and when non-commercials begin to add to net longs. Has not happened yet. Latest holdings were at a 10-month low.
April 15 COT Report Data: Currently net long 13.8k, down 3.5k.
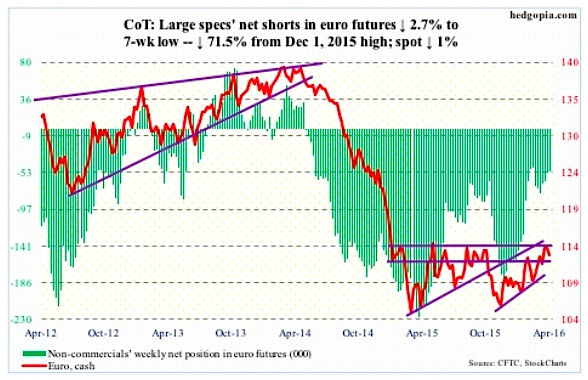
Euro: Eurozone inflation in the year to March has been revised up to flat from the initial estimate of a 0.1-percent drop and February’s 0.2-percent annual decline.
This is not even remotely close to the European Central Bank’s target of just below two percent. And it is just one month’s data. Nonetheless, it is probably a small morale booster for policymakers that are leaving no stone unturned to get the inflation dial moving.
On March 10th, the ECB announced uber-dovish stimulus measures, including purchases of corporate bonds. The move was supposed to weaken the euro, which instead ended up rallying. From 108.22 intra-day on March 10th, the Euro rallied to 114.475 this Monday, retreating since.
Resistance at 114-114.50 goes back to January last year. A breakout here would be massive, but that was not to be – at least not this time.
Daily overbought conditions for the Euro are currently unwinding. The 50- and 200-day moving averages lie at 111.83 and 110.58, respectively.
April 15 COT Report Data: Currently net short 52.1k, down 1.4k.
Thanks for reading.
Twitter: @hedgopia
Read more from Paban on his blog.
The author may hold positions in mentioned securities at the time of publication. Any opinions expressed herein are solely those of the author, and do not in any way represent the views or opinions of any other person or entity.


